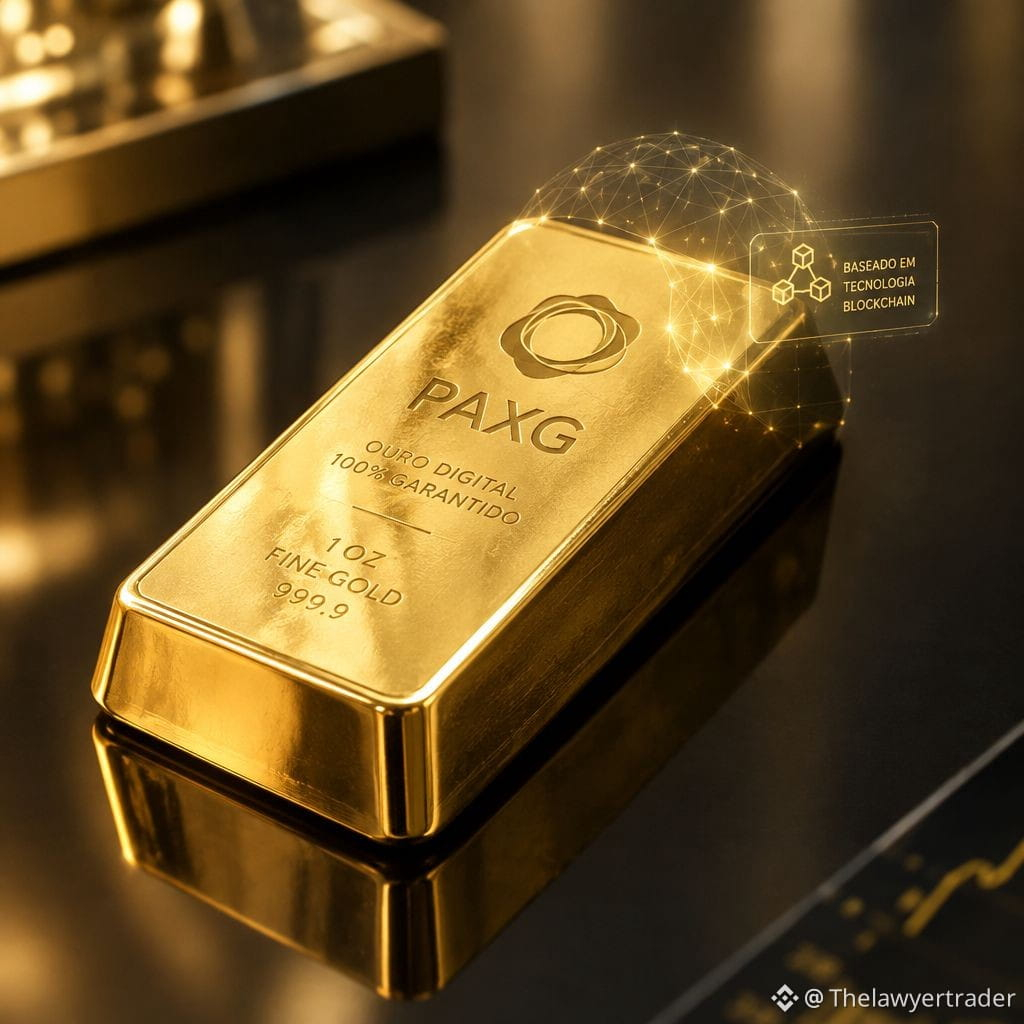
PAXG/USDT (PAX Gold) tests support on the weekly chart
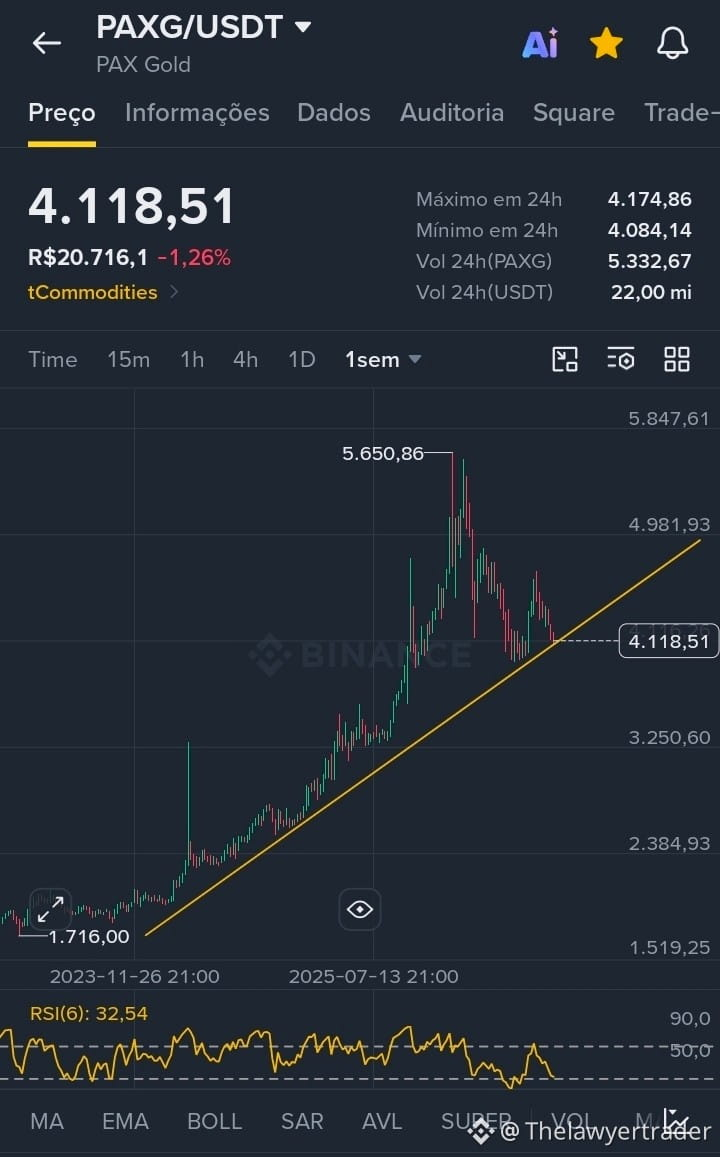
PAXG, a token that tracks the price of physical gold, continues to test its ascending support line after retreating from a high of 5,650.86. The asset is now trading around 4,118.51, with the RSI(6) at 32.54, signaling an oversold zone that could indicate seller exhaustion and a possible short-term bounce.
The main support lies in the 4,084–4,118 region, reinforced by the upward trendline that has supported the move since 1,716. As long as this level holds, the structure of higher highs and higher lows remains valid. The main resistance is at the recent high of 5,650.86, with intermediate resistance levels along the way.
The verifiable chart pattern is an ascending channel, with price currently testing the lower boundary as support. The oversold RSI reading reinforces the possibility of a technical bounce, but confirmation depends on the trendline holding.
This analysis is for informational purposes only and does not constitute investment advice.
#PAXG #PAXGTutorialanalysis $PAXG
PAXG, a token that tracks the price of physical gold, continues to test its ascending support line after retreating from a high of 5,650.86. The asset is now trading around 4,118.51, with the RSI(6) at 32.54, signaling an oversold zone that could indicate seller exhaustion and a possible short-term bounce.
The main support lies in the 4,084–4,118 region, reinforced by the upward trendline that has supported the move since 1,716. As long as this level holds, the structure of higher highs and higher lows remains valid. The main resistance is at the recent high of 5,650.86, with intermediate resistance levels along the way.
The verifiable chart pattern is an ascending channel, with price currently testing the lower boundary as support. The oversold RSI reading reinforces the possibility of a technical bounce, but confirmation depends on the trendline holding.
This analysis is for informational purposes only and does not constitute investment advice.
#PAXG #PAXGTutorialanalysis $PAXG