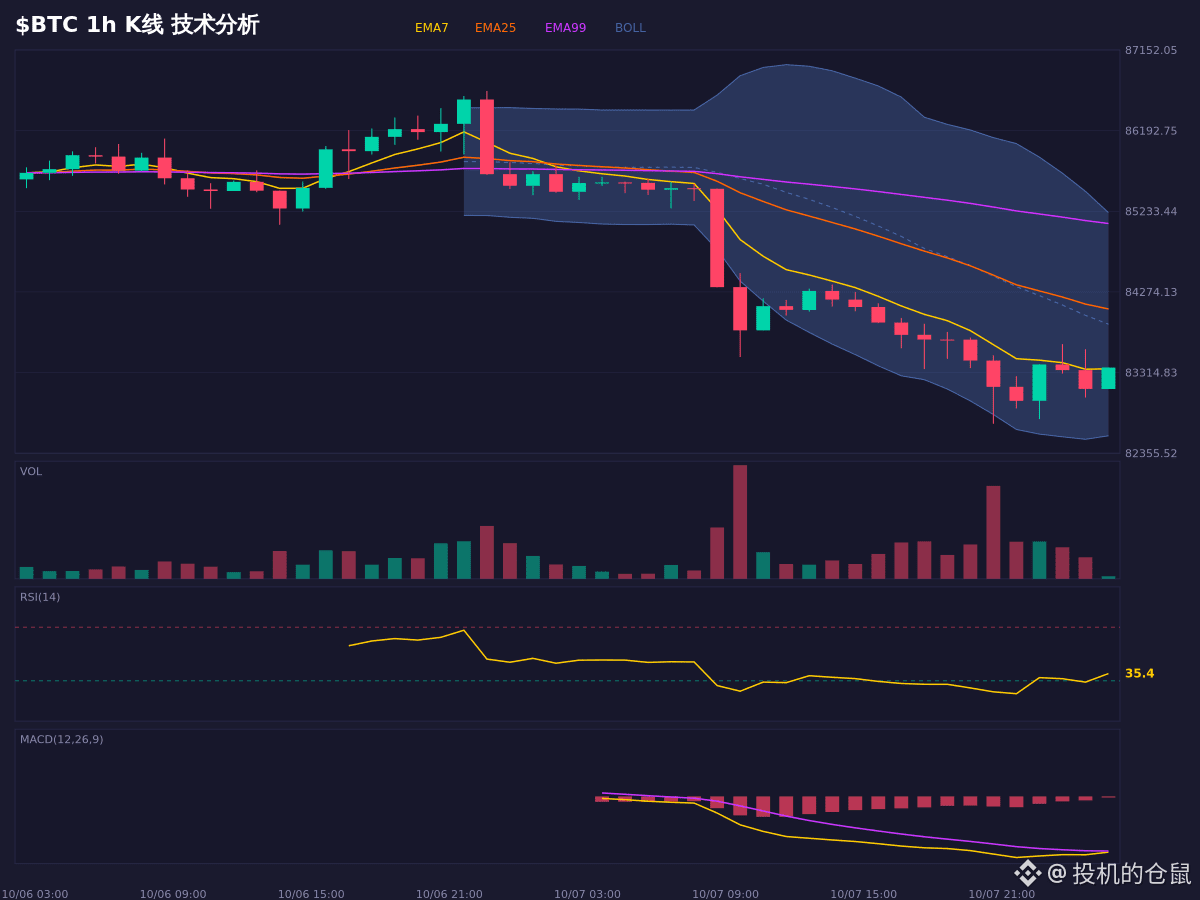
$BTC This bout of volatility is quite interesting. Although the moving averages and MACD both indicate weakness, the long-short ratio has risen to 1.72, with long positions accounting for 63.3%. This divergence is worth watching.
The Bollinger Bands show the price trading weakly below the middle band, while Stoch RSI has entered overbought territory, suggesting possible short-term pullback pressure. The funding rate is slightly negative, indicating a neutral-to-bearish bias.
If the price holds above EMA25 (84062.74), the bullish structure remains intact; if it falls below the lower Bollinger Band (82558.78), the current thesis is invalidated. The previous high + 1x ATR (86184.53) is an important dividing line.
Keep an eye on it; don't follow the trade.
For market observation and conditional scenario analysis only; this is not a record of trading activity.
$BTC #行情分析 #市场情绪 #BullMarket
The Bollinger Bands show the price trading weakly below the middle band, while Stoch RSI has entered overbought territory, suggesting possible short-term pullback pressure. The funding rate is slightly negative, indicating a neutral-to-bearish bias.
If the price holds above EMA25 (84062.74), the bullish structure remains intact; if it falls below the lower Bollinger Band (82558.78), the current thesis is invalidated. The previous high + 1x ATR (86184.53) is an important dividing line.
Keep an eye on it; don't follow the trade.
For market observation and conditional scenario analysis only; this is not a record of trading activity.
$BTC #行情分析 #市场情绪 #BullMarket