$NVDA S&P 500 and Nasdaq hit record highs 🔥
════════════════════
🔴 $NVDA S&P 500 and Nasdaq hit record highs | Short-term bullish · Multi-timeframe confluence
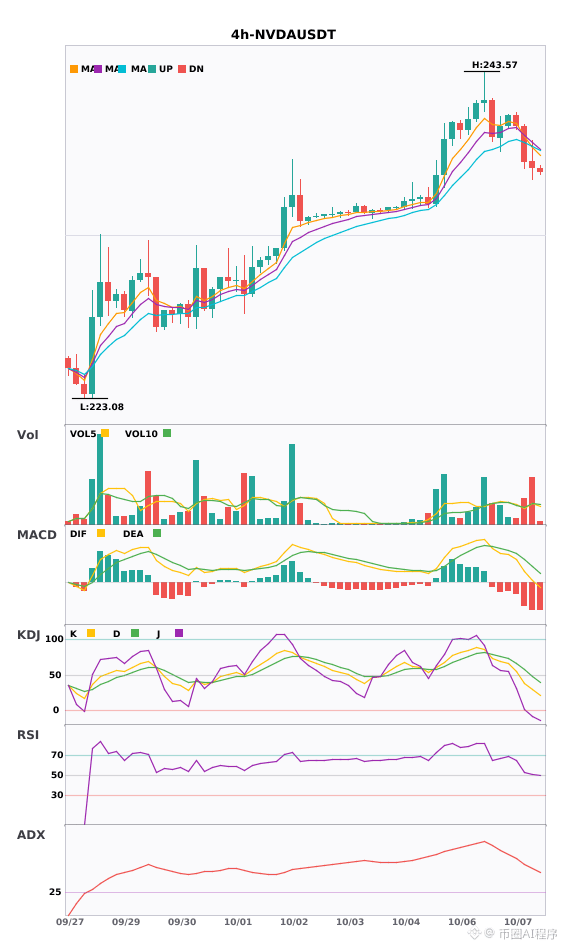
⚠️Technical analysis: NVDA’s daily moving averages are in a bullish alignment and spreading upward. The ADX is as high as 52.7, indicating a very strong trend. After the MACD golden cross, the red bars have continued to grow, showing strong bullish momentum. However, the 4-hour chart is still bottoming out in a consolidation, the 1-hour moving averages have just turned bearish, and the KDJ is also trending downward. This is a typical divergence between timeframes—the broader trend is up, but there is short-term pullback pressure. Support is at 218.48, with resistance at 243.57. A breakout above resistance would signal the start of another rally.
📢Market update: The S&P 500 and Nasdaq have both hit record highs, and enthusiasm for the AI theme remains strong. As a core index heavyweight, NVDA stands to benefit directly, and market sentiment is generally upbeat. However, after the recent short-term gains, some investors are taking profits, and trading volume has dipped somewhat.
════════════════════
🔔 Follow for real-time market updates 🔔
#技术分析 #多周期共振 #标普500与纳指创历史新高 #NVDA
📌 When trading, pay attention to whether the candlestick patterns align
════════════════════
🔴 $NVDA S&P 500 and Nasdaq hit record highs | Short-term bullish · Multi-timeframe confluence
⚠️Technical analysis: NVDA’s daily moving averages are in a bullish alignment and spreading upward. The ADX is as high as 52.7, indicating a very strong trend. After the MACD golden cross, the red bars have continued to grow, showing strong bullish momentum. However, the 4-hour chart is still bottoming out in a consolidation, the 1-hour moving averages have just turned bearish, and the KDJ is also trending downward. This is a typical divergence between timeframes—the broader trend is up, but there is short-term pullback pressure. Support is at 218.48, with resistance at 243.57. A breakout above resistance would signal the start of another rally.
📢Market update: The S&P 500 and Nasdaq have both hit record highs, and enthusiasm for the AI theme remains strong. As a core index heavyweight, NVDA stands to benefit directly, and market sentiment is generally upbeat. However, after the recent short-term gains, some investors are taking profits, and trading volume has dipped somewhat.
════════════════════
🔔 Follow for real-time market updates 🔔
#技术分析 #多周期共振 #标普500与纳指创历史新高 #NVDA
📌 When trading, pay attention to whether the candlestick patterns align