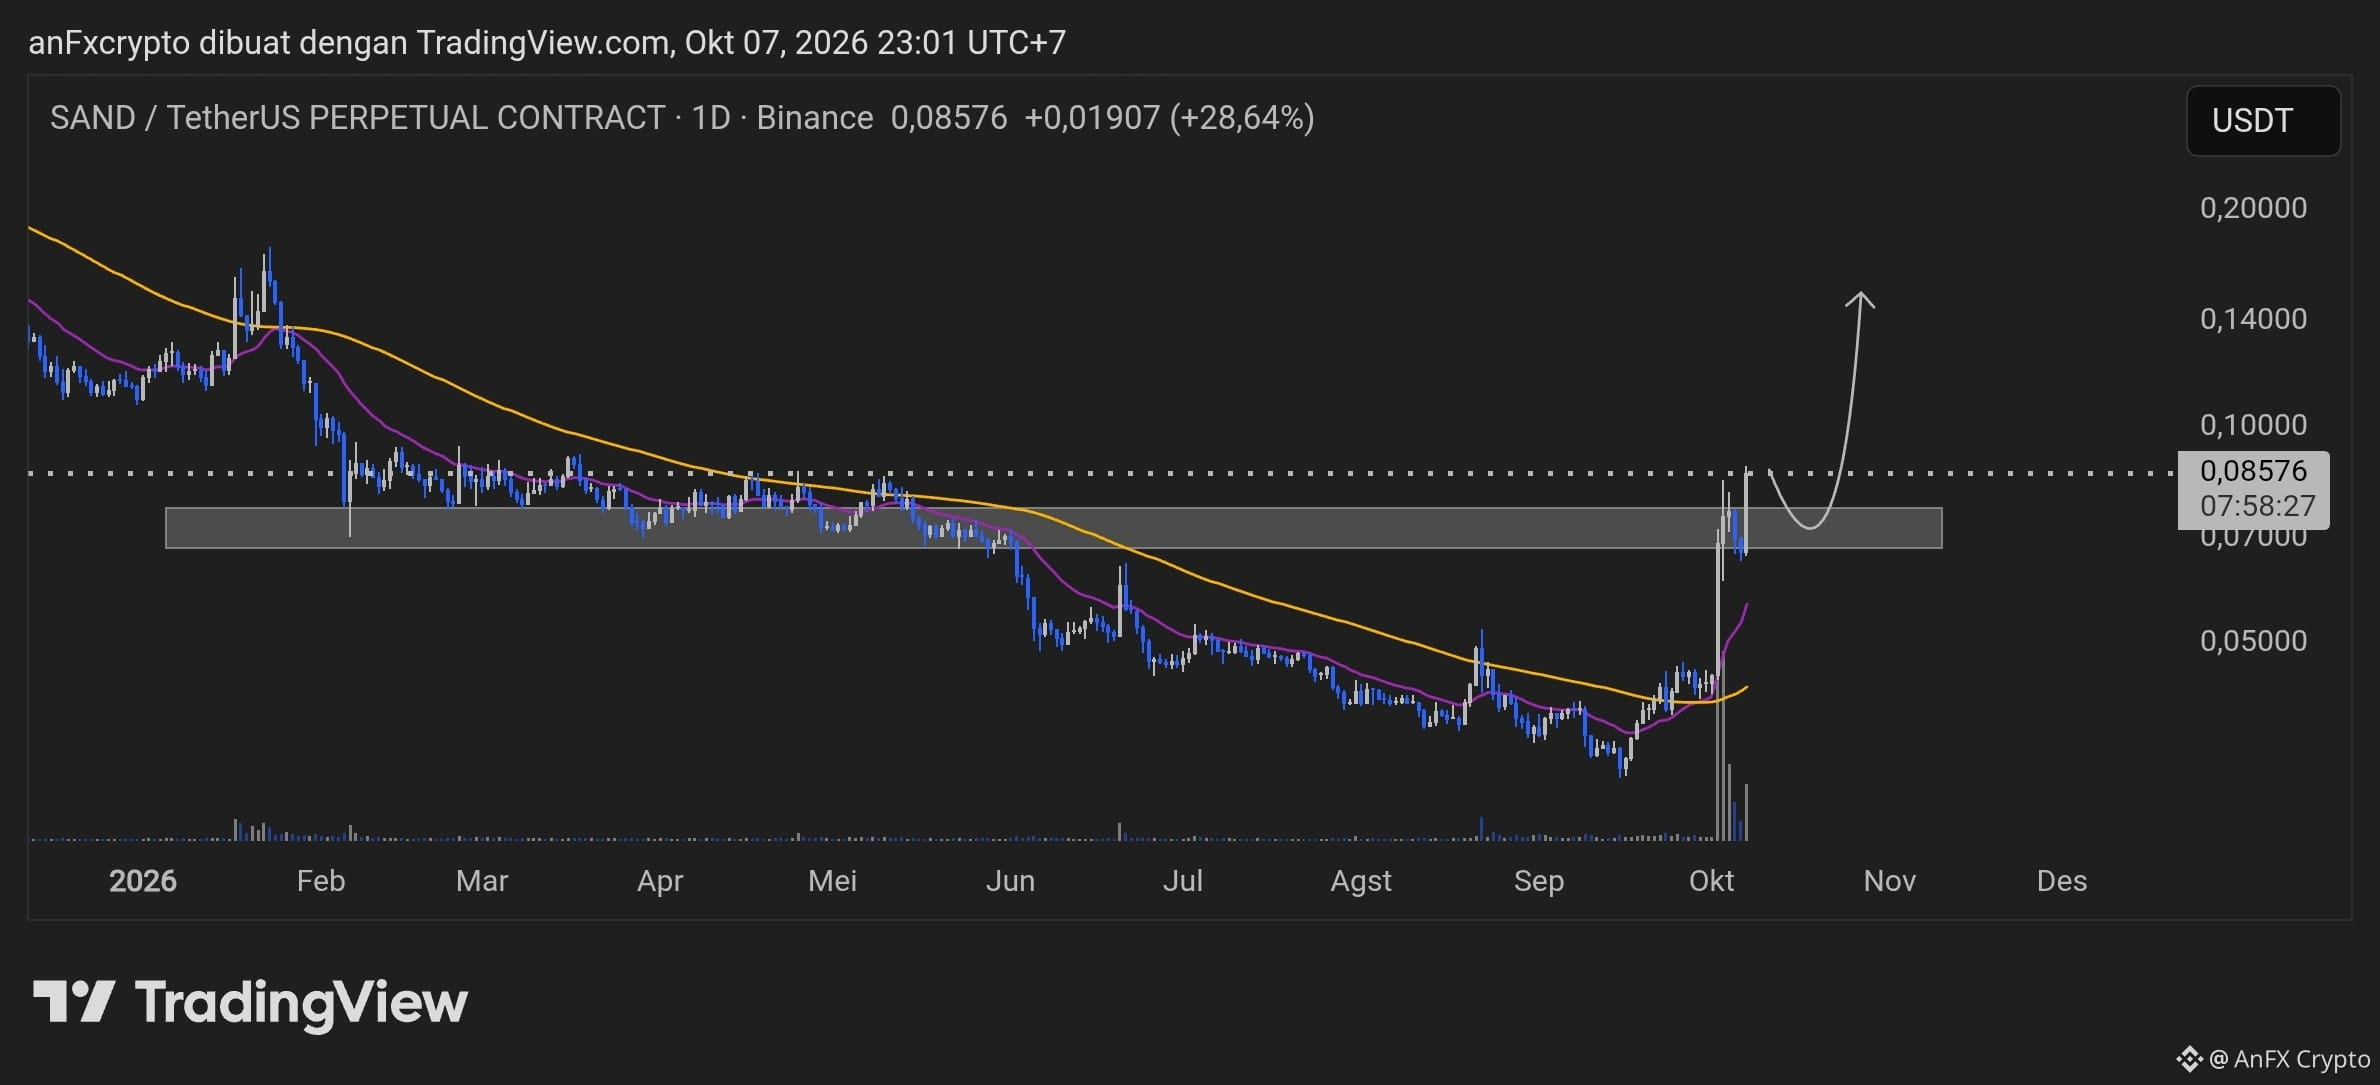
The daily chart for $SAND /USDT shows confirmation of an impulsive breakout from a long-term downtrend, with a price surge reaching 0.08576 USDT (+28.64%). Based on the price action pattern, the ideal strategy is to wait for a correction phase (pullback) to the support area before opening a long or buy position.
Technical Analysis (SAND/USDT - Daily)
Market Structure: The sharp rise above the Moving Average lines (yellow and purple) signals the beginning of a trend reversal from bearish to bullish.
Retest Area: Before continuing its rally, the price may retest the demand zone in the gray box, around 0.07000–0.07800 USDT.
Upside Potential: If support holds, the price could continue strengthening toward 0.14000 USDT and potentially above 0.15000 USDT.
Trading Parameters
Price (USDT)
Description
Entry Area (Buy Zone)
0.07000–0.07800
Scale in on a pullback to the gray box
Take Profit 1 (TP1)
0.10000
Nearest psychological resistance level
Take Profit 2 (TP2)
0.14000
Intermediate swing-high target
Take Profit 3 (TP3)
0.18000
Main projected rally target
Stop Loss (SL)
0.06400
Limit risk if the price breaks below the demand zone
Risk Management & Execution Strategy
Risk-Reward Ratio (RRR): More than 1:4, providing a well-defined risk-to-reward ratio for a swing trading strategy.
Capital Management: Avoid FOMO buying at the current peak. Place limit orders in the entry area and allocate a maximum of 2% to 3% of your total trading capital to risk.
Use of Leverage: Use Spot trading or low leverage (maximum 2x–3x in the Futures market) to account for volatility during the correction phase.
Technical Analysis (SAND/USDT - Daily)
Market Structure: The sharp rise above the Moving Average lines (yellow and purple) signals the beginning of a trend reversal from bearish to bullish.
Retest Area: Before continuing its rally, the price may retest the demand zone in the gray box, around 0.07000–0.07800 USDT.
Upside Potential: If support holds, the price could continue strengthening toward 0.14000 USDT and potentially above 0.15000 USDT.
Trading Parameters
Price (USDT)
Description
Entry Area (Buy Zone)
0.07000–0.07800
Scale in on a pullback to the gray box
Take Profit 1 (TP1)
0.10000
Nearest psychological resistance level
Take Profit 2 (TP2)
0.14000
Intermediate swing-high target
Take Profit 3 (TP3)
0.18000
Main projected rally target
Stop Loss (SL)
0.06400
Limit risk if the price breaks below the demand zone
Risk Management & Execution Strategy
Risk-Reward Ratio (RRR): More than 1:4, providing a well-defined risk-to-reward ratio for a swing trading strategy.
Capital Management: Avoid FOMO buying at the current peak. Place limit orders in the entry area and allocate a maximum of 2% to 3% of your total trading capital to risk.
Use of Leverage: Use Spot trading or low leverage (maximum 2x–3x in the Futures market) to account for volatility during the correction phase.