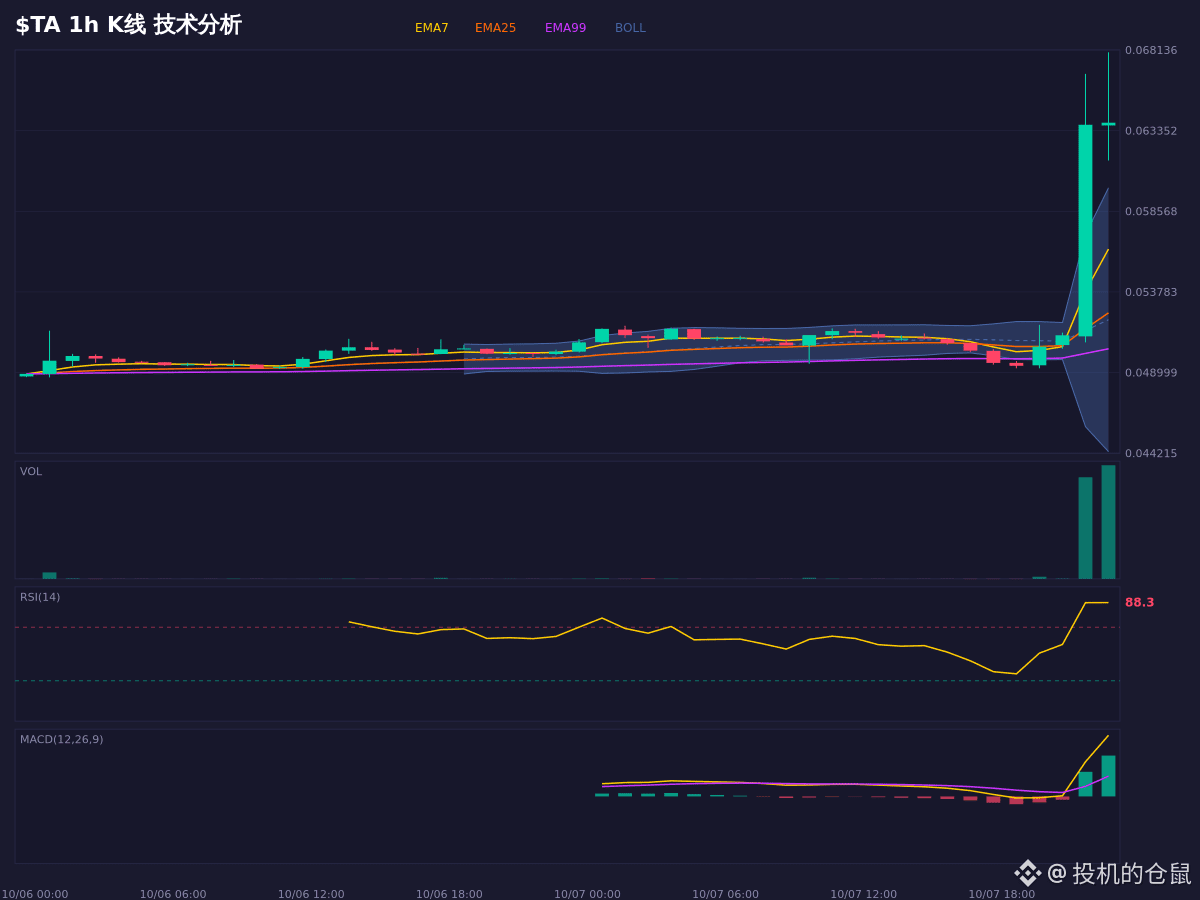
$TA This rally is indeed astonishing, but the technical indicators are showing clear conflicting signals. On one hand, the moving averages are in a bullish alignment and the MACD histogram is expanding, indicating a strong trend. On the other hand, both the RSI and Stoch RSI are overbought, pointing to significant pullback pressure.
The price has now broken above the upper Bollinger Band, so it may continue to climb in the short term. However, if the overbought conditions persist, the risk of a pullback should not be overlooked. If the price can hold support near 0.061, the bullish structure may continue; if it falls below 0.0515, the current bullish thesis will be invalidated.
For market observation and conditional scenario analysis only; this is not a record of trading activity.
$TA #交易 #行情分析 #Bear market
The price has now broken above the upper Bollinger Band, so it may continue to climb in the short term. However, if the overbought conditions persist, the risk of a pullback should not be overlooked. If the price can hold support near 0.061, the bullish structure may continue; if it falls below 0.0515, the current bullish thesis will be invalidated.
For market observation and conditional scenario analysis only; this is not a record of trading activity.
$TA #交易 #行情分析 #Bear market