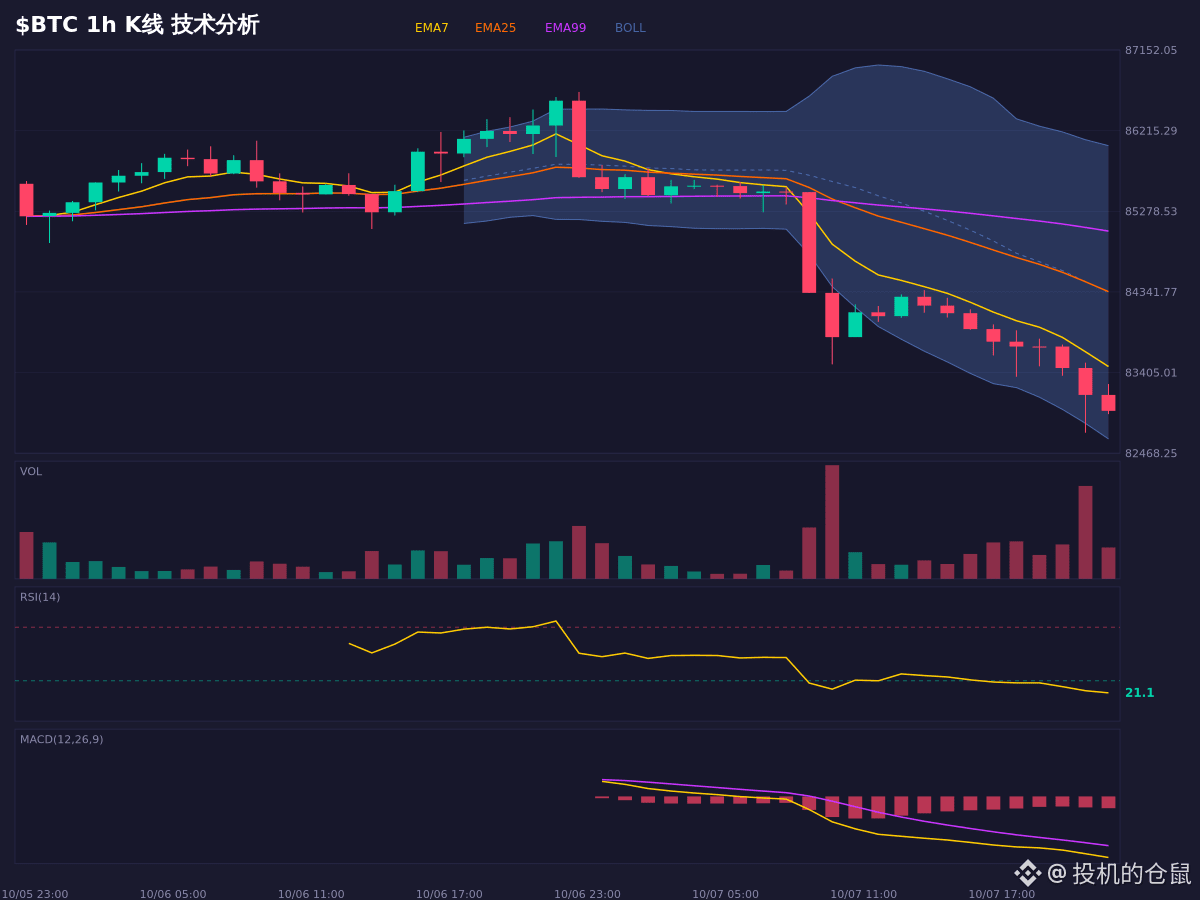
Just finished dinner and flopped onto the sofa to check the charts. $BTC has taken a pretty brutal hit this time. A few indicators really stand out: the 1-hour RSI is only 20, in oversold territory; the Stoch RSI is also at 4.3, which is oversold. Most importantly, there’s a bullish divergence: the price has made a new low, but the RSI hasn’t. Historically, this combination often signals a rebound.
However, although the MACD histogram bars are shrinking, the DIF and DEA are still in a bearish crossover and heading down, so bearish momentum is still present. The contradiction is that oversold conditions and bullish divergence hint at a rebound, while the moving averages remain bearishly aligned, with EMA7 below EMA25, indicating a weak trend.
If it holds above 83469 (EMA7), the bullish structure may continue; if it breaks below 82628 (lower Bollinger Band), the current rebound thesis is invalidated. The key is whether it comes under renewed pressure near 86043 (upper Bollinger Band) as it rebounds. This is for chart observation and conditional scenario analysis only, and does not constitute a record of trading activity.
$BTC #交易 #现货 #Futures
However, although the MACD histogram bars are shrinking, the DIF and DEA are still in a bearish crossover and heading down, so bearish momentum is still present. The contradiction is that oversold conditions and bullish divergence hint at a rebound, while the moving averages remain bearishly aligned, with EMA7 below EMA25, indicating a weak trend.
If it holds above 83469 (EMA7), the bullish structure may continue; if it breaks below 82628 (lower Bollinger Band), the current rebound thesis is invalidated. The key is whether it comes under renewed pressure near 86043 (upper Bollinger Band) as it rebounds. This is for chart observation and conditional scenario analysis only, and does not constitute a record of trading activity.
$BTC #交易 #现货 #Futures