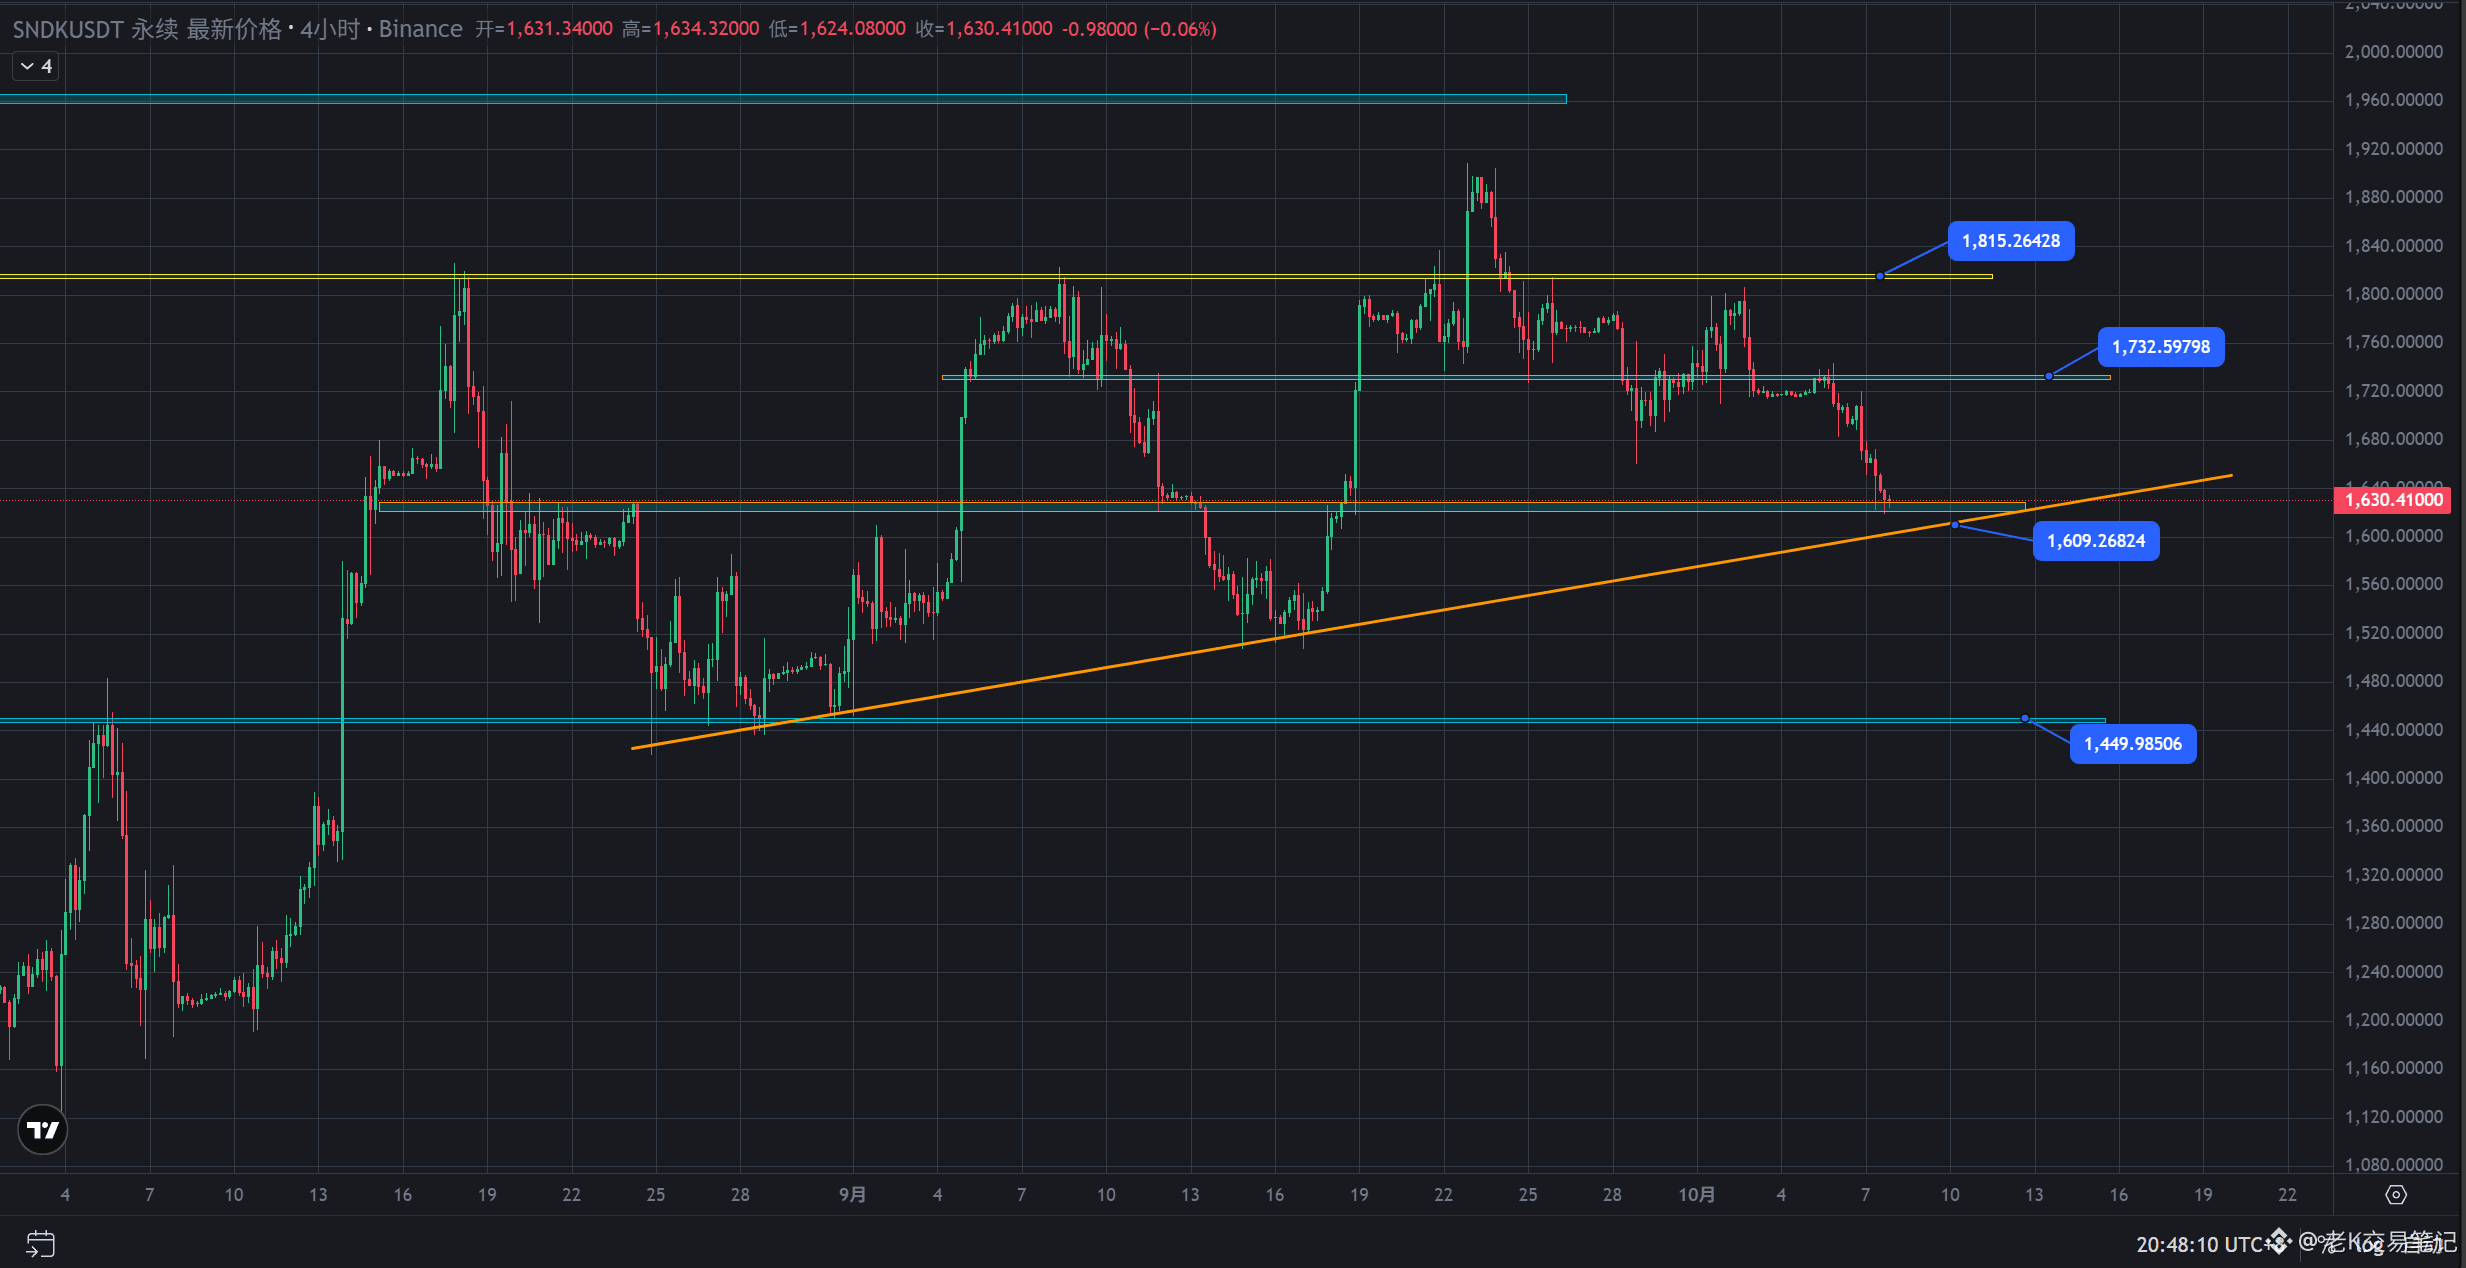
$SNDK 4 hours: Price has reached key support. Will it rebound or break down? Let's watch this area first.
At around 1630 on the chart, SNDK has pulled back to the 1620–1630 horizontal support zone, with an ascending trendline drawn from the previous lows just below it. How price behaves here will determine whether I trade based on a rebound or a breakdown.
The short-term trend is currently weak: price has pulled back from its highs and failed to hold above 1732. But reaching support doesn't mean a bottom is in, and being near the trendline doesn't guarantee a rebound.
I have two possible plans:
① Support holds: If price tests the 1600–1630 area, then the 4-hour chart closes back above 1630 and holds on a retest, I may consider a small-position rebound trade. I’ll watch 1680 first, then 1732; only if price establishes itself above 1732 will I consider 1815.
② Support fails: If the 4-hour chart breaks below the ascending trendline and the area around 1600, then price rebounds but fails to reclaim that level, I’ll switch to looking for short entries on the rebound. I’ll watch 1520 first, then 1450.
The 1609 shown on the chart is a reference value for the projected trendline. Actual support will move higher over time, so it needs to be updated based on the position of the candlesticks.
Right now, I’m paying closer attention to the candle closes near support and the outcome of any retest. I’ll wait for confirmation and only calculate position size based on the stop-loss distance once my entry conditions are met. I won’t try to catch the bottom early just because it “has fallen enough.”
#SNDK #技术分析 #交易计划
At around 1630 on the chart, SNDK has pulled back to the 1620–1630 horizontal support zone, with an ascending trendline drawn from the previous lows just below it. How price behaves here will determine whether I trade based on a rebound or a breakdown.
The short-term trend is currently weak: price has pulled back from its highs and failed to hold above 1732. But reaching support doesn't mean a bottom is in, and being near the trendline doesn't guarantee a rebound.
I have two possible plans:
① Support holds: If price tests the 1600–1630 area, then the 4-hour chart closes back above 1630 and holds on a retest, I may consider a small-position rebound trade. I’ll watch 1680 first, then 1732; only if price establishes itself above 1732 will I consider 1815.
② Support fails: If the 4-hour chart breaks below the ascending trendline and the area around 1600, then price rebounds but fails to reclaim that level, I’ll switch to looking for short entries on the rebound. I’ll watch 1520 first, then 1450.
The 1609 shown on the chart is a reference value for the projected trendline. Actual support will move higher over time, so it needs to be updated based on the position of the candlesticks.
Right now, I’m paying closer attention to the candle closes near support and the outcome of any retest. I’ll wait for confirmation and only calculate position size based on the stop-loss distance once my entry conditions are met. I won’t try to catch the bottom early just because it “has fallen enough.”
#SNDK #技术分析 #交易计划