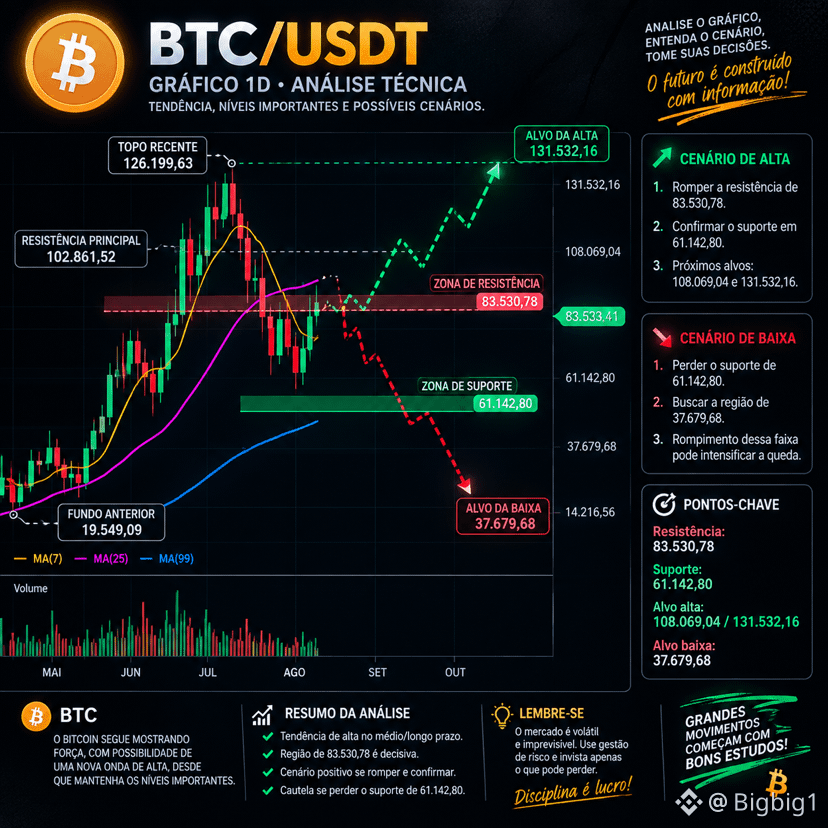
📊 BTC/USDT Analysis — banner scenario
Bitcoin is at a decisive level, near US$83,530, which the banner treats as immediate resistance.
🟢 Bullish scenario
* The first step would be to break above US$83,530 and confirm the breakout.
* If buying pressure is strong and the breakout is confirmed, the next projected move would be toward the US$102,861 region.
* A move above that region would open the way for approximately US$108,069.
* If the trend continues more strongly, the banner’s projection points to US$131,532, near the previous high of US$126,199.
🔴 Bearish scenario
* If BTC fails to break above US$83,530 and loses momentum again, the first important level is US$61,142.
* A break below that support would increase the possibility of a move toward the US$37,679 region.
* So, US$61,000 is the level I’d watch closely to gauge whether the recovery is still intact.
🔥 What I think matters most
The key point isn’t simply to say “BTC is going up.”
It’s to watch how price reacts at US$83,530.
If it breaks through on strong volume and manages to turn this former resistance into support, the outlook becomes considerably more interesting for another upward move. If it gets rejected again, a correction could occur before another attempt.
My reading of the chart: further gains are possible, but BTC still needs to prove its strength at this level. I wouldn’t treat US$108,000 or US$131,000 as forecasts—they’re scenario targets, conditional on breakouts.
⚠️ This is technical analysis based on the chart provided, not a recommendation to buy or sell. Crypto can move violently in either direction. $BTC #btc #BinanceLaunchesBinanceIntelligence
Bitcoin is at a decisive level, near US$83,530, which the banner treats as immediate resistance.
🟢 Bullish scenario
* The first step would be to break above US$83,530 and confirm the breakout.
* If buying pressure is strong and the breakout is confirmed, the next projected move would be toward the US$102,861 region.
* A move above that region would open the way for approximately US$108,069.
* If the trend continues more strongly, the banner’s projection points to US$131,532, near the previous high of US$126,199.
🔴 Bearish scenario
* If BTC fails to break above US$83,530 and loses momentum again, the first important level is US$61,142.
* A break below that support would increase the possibility of a move toward the US$37,679 region.
* So, US$61,000 is the level I’d watch closely to gauge whether the recovery is still intact.
🔥 What I think matters most
The key point isn’t simply to say “BTC is going up.”
It’s to watch how price reacts at US$83,530.
If it breaks through on strong volume and manages to turn this former resistance into support, the outlook becomes considerably more interesting for another upward move. If it gets rejected again, a correction could occur before another attempt.
My reading of the chart: further gains are possible, but BTC still needs to prove its strength at this level. I wouldn’t treat US$108,000 or US$131,000 as forecasts—they’re scenario targets, conditional on breakouts.
⚠️ This is technical analysis based on the chart provided, not a recommendation to buy or sell. Crypto can move violently in either direction. $BTC #btc #BinanceLaunchesBinanceIntelligence