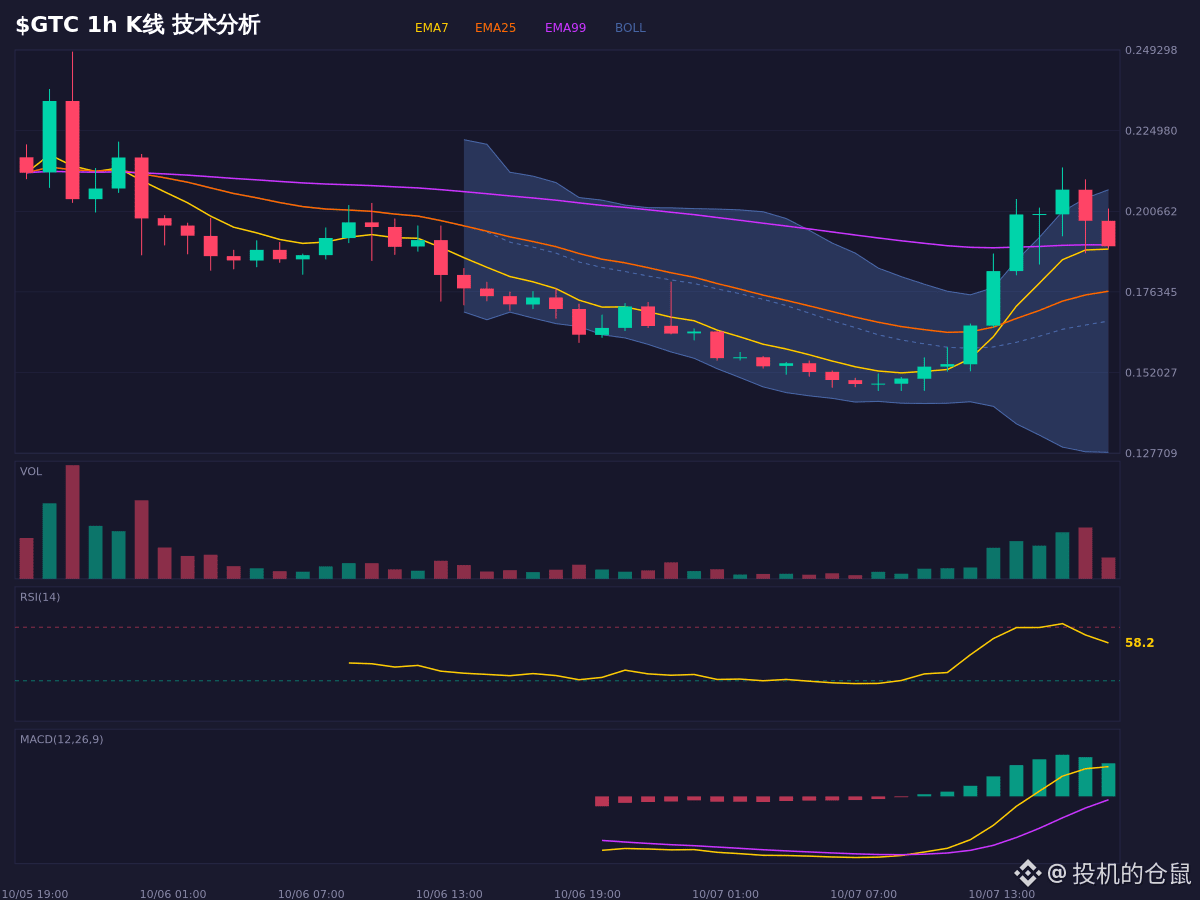
$GTC This 16% surge is certainly impressive, but a closer look at several key indicators reveals conflicting signals worth watching.
The Bollinger Bands show the price trading above the middle band. The 47% bandwidth indicates high volatility, and the overall bias is bullish. However, both the K and D values of the Stoch RSI have climbed above 83, entering overbought territory and signaling clear short-term pullback pressure.
More concerning is the bearish divergence: the price has reached a new high, but the RSI has failed to follow suit—a classic sign of weakening upward momentum.
If the price finds support and holds in the 0.188–0.198 range, the bullish structure may continue. If it breaks below the key support at 0.166, the current bullish thesis is invalidated.
This is for market observation and conditional scenario analysis only; it does not constitute a record of trading activity.
$GTC #现货 #合约 #Bear market
The Bollinger Bands show the price trading above the middle band. The 47% bandwidth indicates high volatility, and the overall bias is bullish. However, both the K and D values of the Stoch RSI have climbed above 83, entering overbought territory and signaling clear short-term pullback pressure.
More concerning is the bearish divergence: the price has reached a new high, but the RSI has failed to follow suit—a classic sign of weakening upward momentum.
If the price finds support and holds in the 0.188–0.198 range, the bullish structure may continue. If it breaks below the key support at 0.166, the current bullish thesis is invalidated.
This is for market observation and conditional scenario analysis only; it does not constitute a record of trading activity.
$GTC #现货 #合约 #Bear market