$ETH Why did the market suddenly dump this time?#比特币跌破8.4万美元
In my opinion, ETH’s drop from above 2,700 to around 2,600 was caused by several factors combining:
① Failed breakout at the highs, with profit-taking beginning
ETH had rallied all the way from around 1,500 to around 2,800, a huge gain. The daily-chart bearish divergence had been there for a while, so a pullback was due.
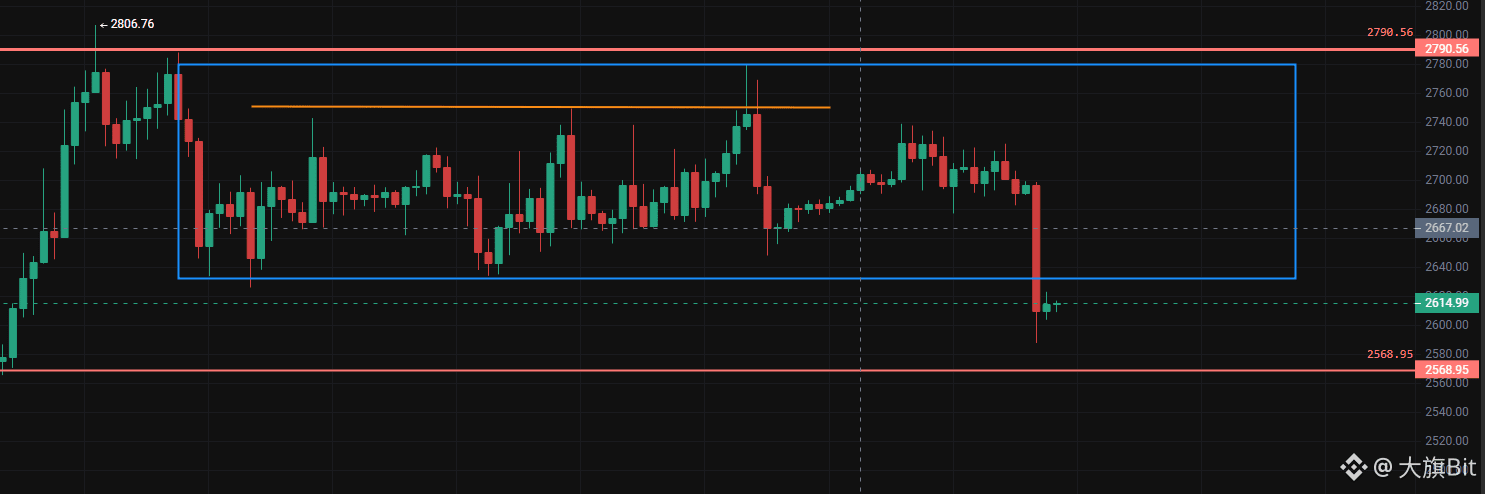
But after repeatedly trading sideways between 2,650 and 2,800, ETH still couldn’t break decisively above 2,800, so early bulls began taking profits.
② Losing 2,700 broke the technical structure
A large bearish candle on the 4-hour chart came with a sharp increase in volume, sending ETH from around 2,696 down to 2,587. This showed that it was no longer an ordinary, minor pullback—the structure at the highs had clearly weakened.
③ Bears began entering the market as spot capital flowed out
As prices fell, open interest increased significantly. This suggests the market wasn’t simply “lacking buyers”; new short positions were opening, while long stop-losses and liquidations further amplified the drop.
That led to a chain reaction: profit-taking at the highs → 2,700 lost → long stop-losses → shorts added to their positions → liquidations accelerated → ETH plunged rapidly
🔥 The real key level is still around 2,570!
At around 2,600, the price is already very close to 2,570, so this isn’t a good place to blindly chase shorts.
Here’s what I’m watching next:
📌 2,630–2,650: Key zone for shorting a rebound
📌 2,570: Key support level between bulls and bears
📌 A decisive break below 2,565: Bears may target 2,520 → 2,480–2,500
📌 If price wicks down around 2,570, finds support, and climbs back above 2,600: Watch for a rebound to 2,640–2,670
So don’t try to guess the bottom, and don’t emotionally chase shorts around 2,600.
Wait for the right levels, confirmation, and signals.
Follow me for more updates!!!
In my opinion, ETH’s drop from above 2,700 to around 2,600 was caused by several factors combining:
① Failed breakout at the highs, with profit-taking beginning
ETH had rallied all the way from around 1,500 to around 2,800, a huge gain. The daily-chart bearish divergence had been there for a while, so a pullback was due.
But after repeatedly trading sideways between 2,650 and 2,800, ETH still couldn’t break decisively above 2,800, so early bulls began taking profits.
② Losing 2,700 broke the technical structure
A large bearish candle on the 4-hour chart came with a sharp increase in volume, sending ETH from around 2,696 down to 2,587. This showed that it was no longer an ordinary, minor pullback—the structure at the highs had clearly weakened.
③ Bears began entering the market as spot capital flowed out
As prices fell, open interest increased significantly. This suggests the market wasn’t simply “lacking buyers”; new short positions were opening, while long stop-losses and liquidations further amplified the drop.
That led to a chain reaction: profit-taking at the highs → 2,700 lost → long stop-losses → shorts added to their positions → liquidations accelerated → ETH plunged rapidly
🔥 The real key level is still around 2,570!
At around 2,600, the price is already very close to 2,570, so this isn’t a good place to blindly chase shorts.
Here’s what I’m watching next:
📌 2,630–2,650: Key zone for shorting a rebound
📌 2,570: Key support level between bulls and bears
📌 A decisive break below 2,565: Bears may target 2,520 → 2,480–2,500
📌 If price wicks down around 2,570, finds support, and climbs back above 2,600: Watch for a rebound to 2,640–2,670
So don’t try to guess the bottom, and don’t emotionally chase shorts around 2,600.
Wait for the right levels, confirmation, and signals.
Follow me for more updates!!!