




The Sandbox (SAND) fell more than 10% in 24 hours, recording the steepest decline among major gaming tokens as the sector entered an early-October correction.
SAND rose more than 80% in September and over 68% in the past week. Although its short-term price structure has weakened, easing selling pressure and increased token withdrawals from exchanges are creating mixed signals against the price action.
MAIN CONTENT
Trading volume in the gaming sector fell 23% in 24 hours to $887 million.
More than 17 million SAND left exchanges in two days, while selling volume fell sharply compared with October 2.
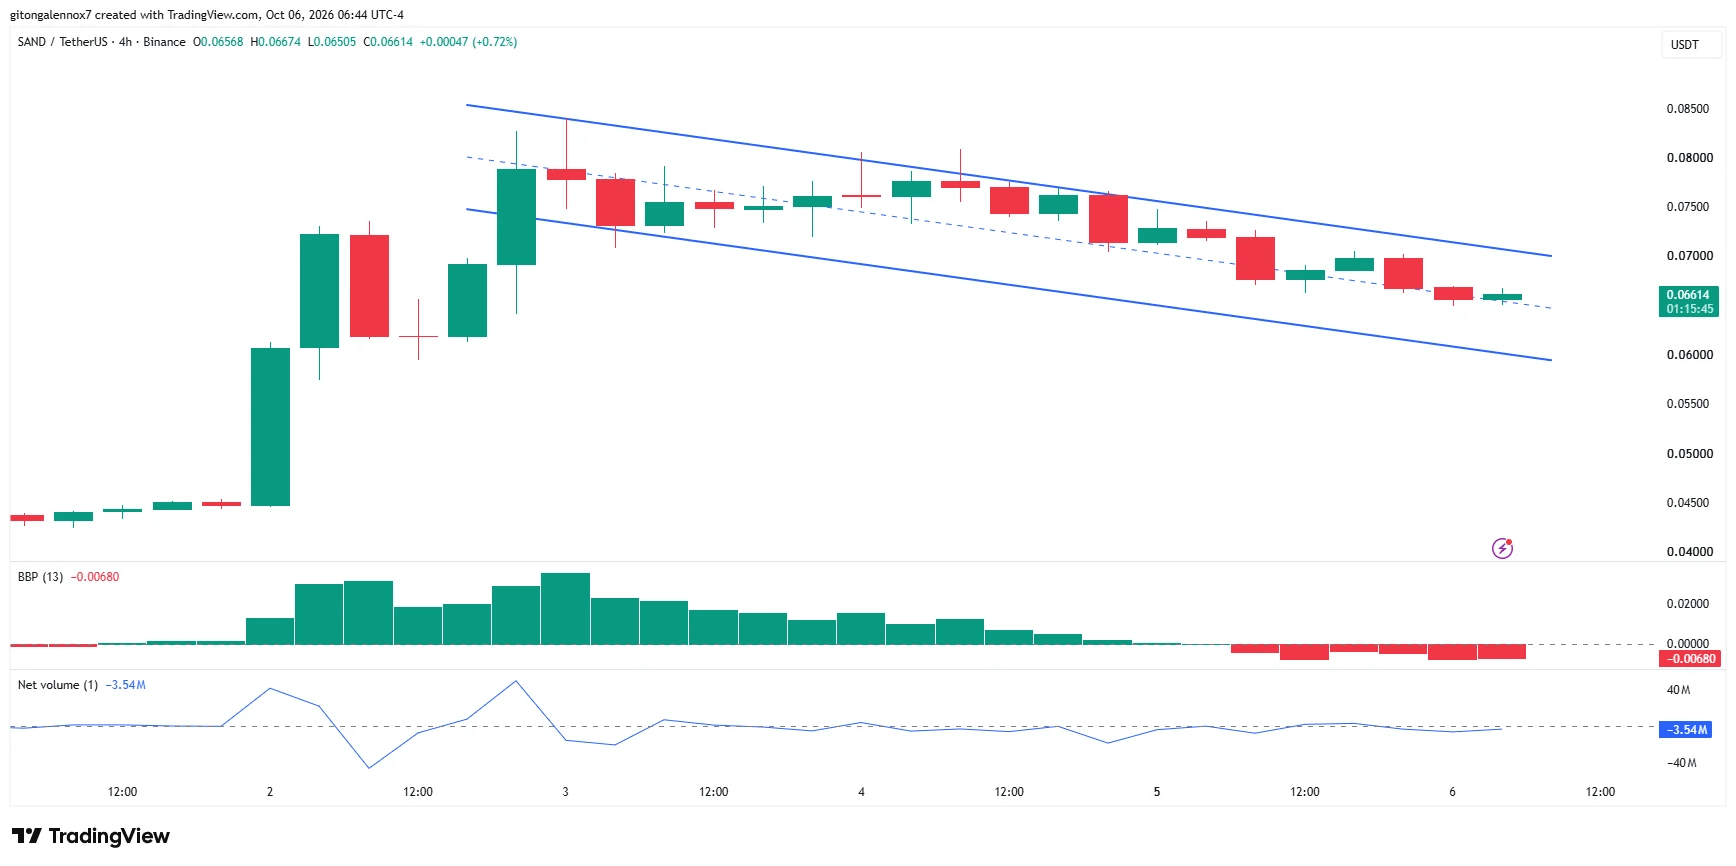
SAND remains within a descending price channel; levels to watch include $0.06, $0.085, and $0.043.
Why did SAND fall after its strong rally?
SAND has fallen alongside the gaming sector's correction since the start of October, while interest in The Sandbox has weakened. Both trading volume and the sector's market cap declined over 24 hours.
According to CoinMarketCap, attention devoted to The Sandbox, or mindshare, fell 14% over the day. Total mentions and interactions also declined by more than 2,000 to around 10,600, alongside weakening price action.
Metric Time period Recorded data SAND price change 24 hours Down more than 10% SAND price change Past week Up more than 68% SAND price change September Up more than 80% Gaming sector trading volume 24 hours Down 23% to $887 million Gaming sector market cap 24 hours Down about 1% to around $7.5 billion The Sandbox mindshare 24 hours Down 14% The Sandbox mentions and interactions One day Down by more than 2,000 to around 10,600
Selling pressure eases as SAND flows off exchanges
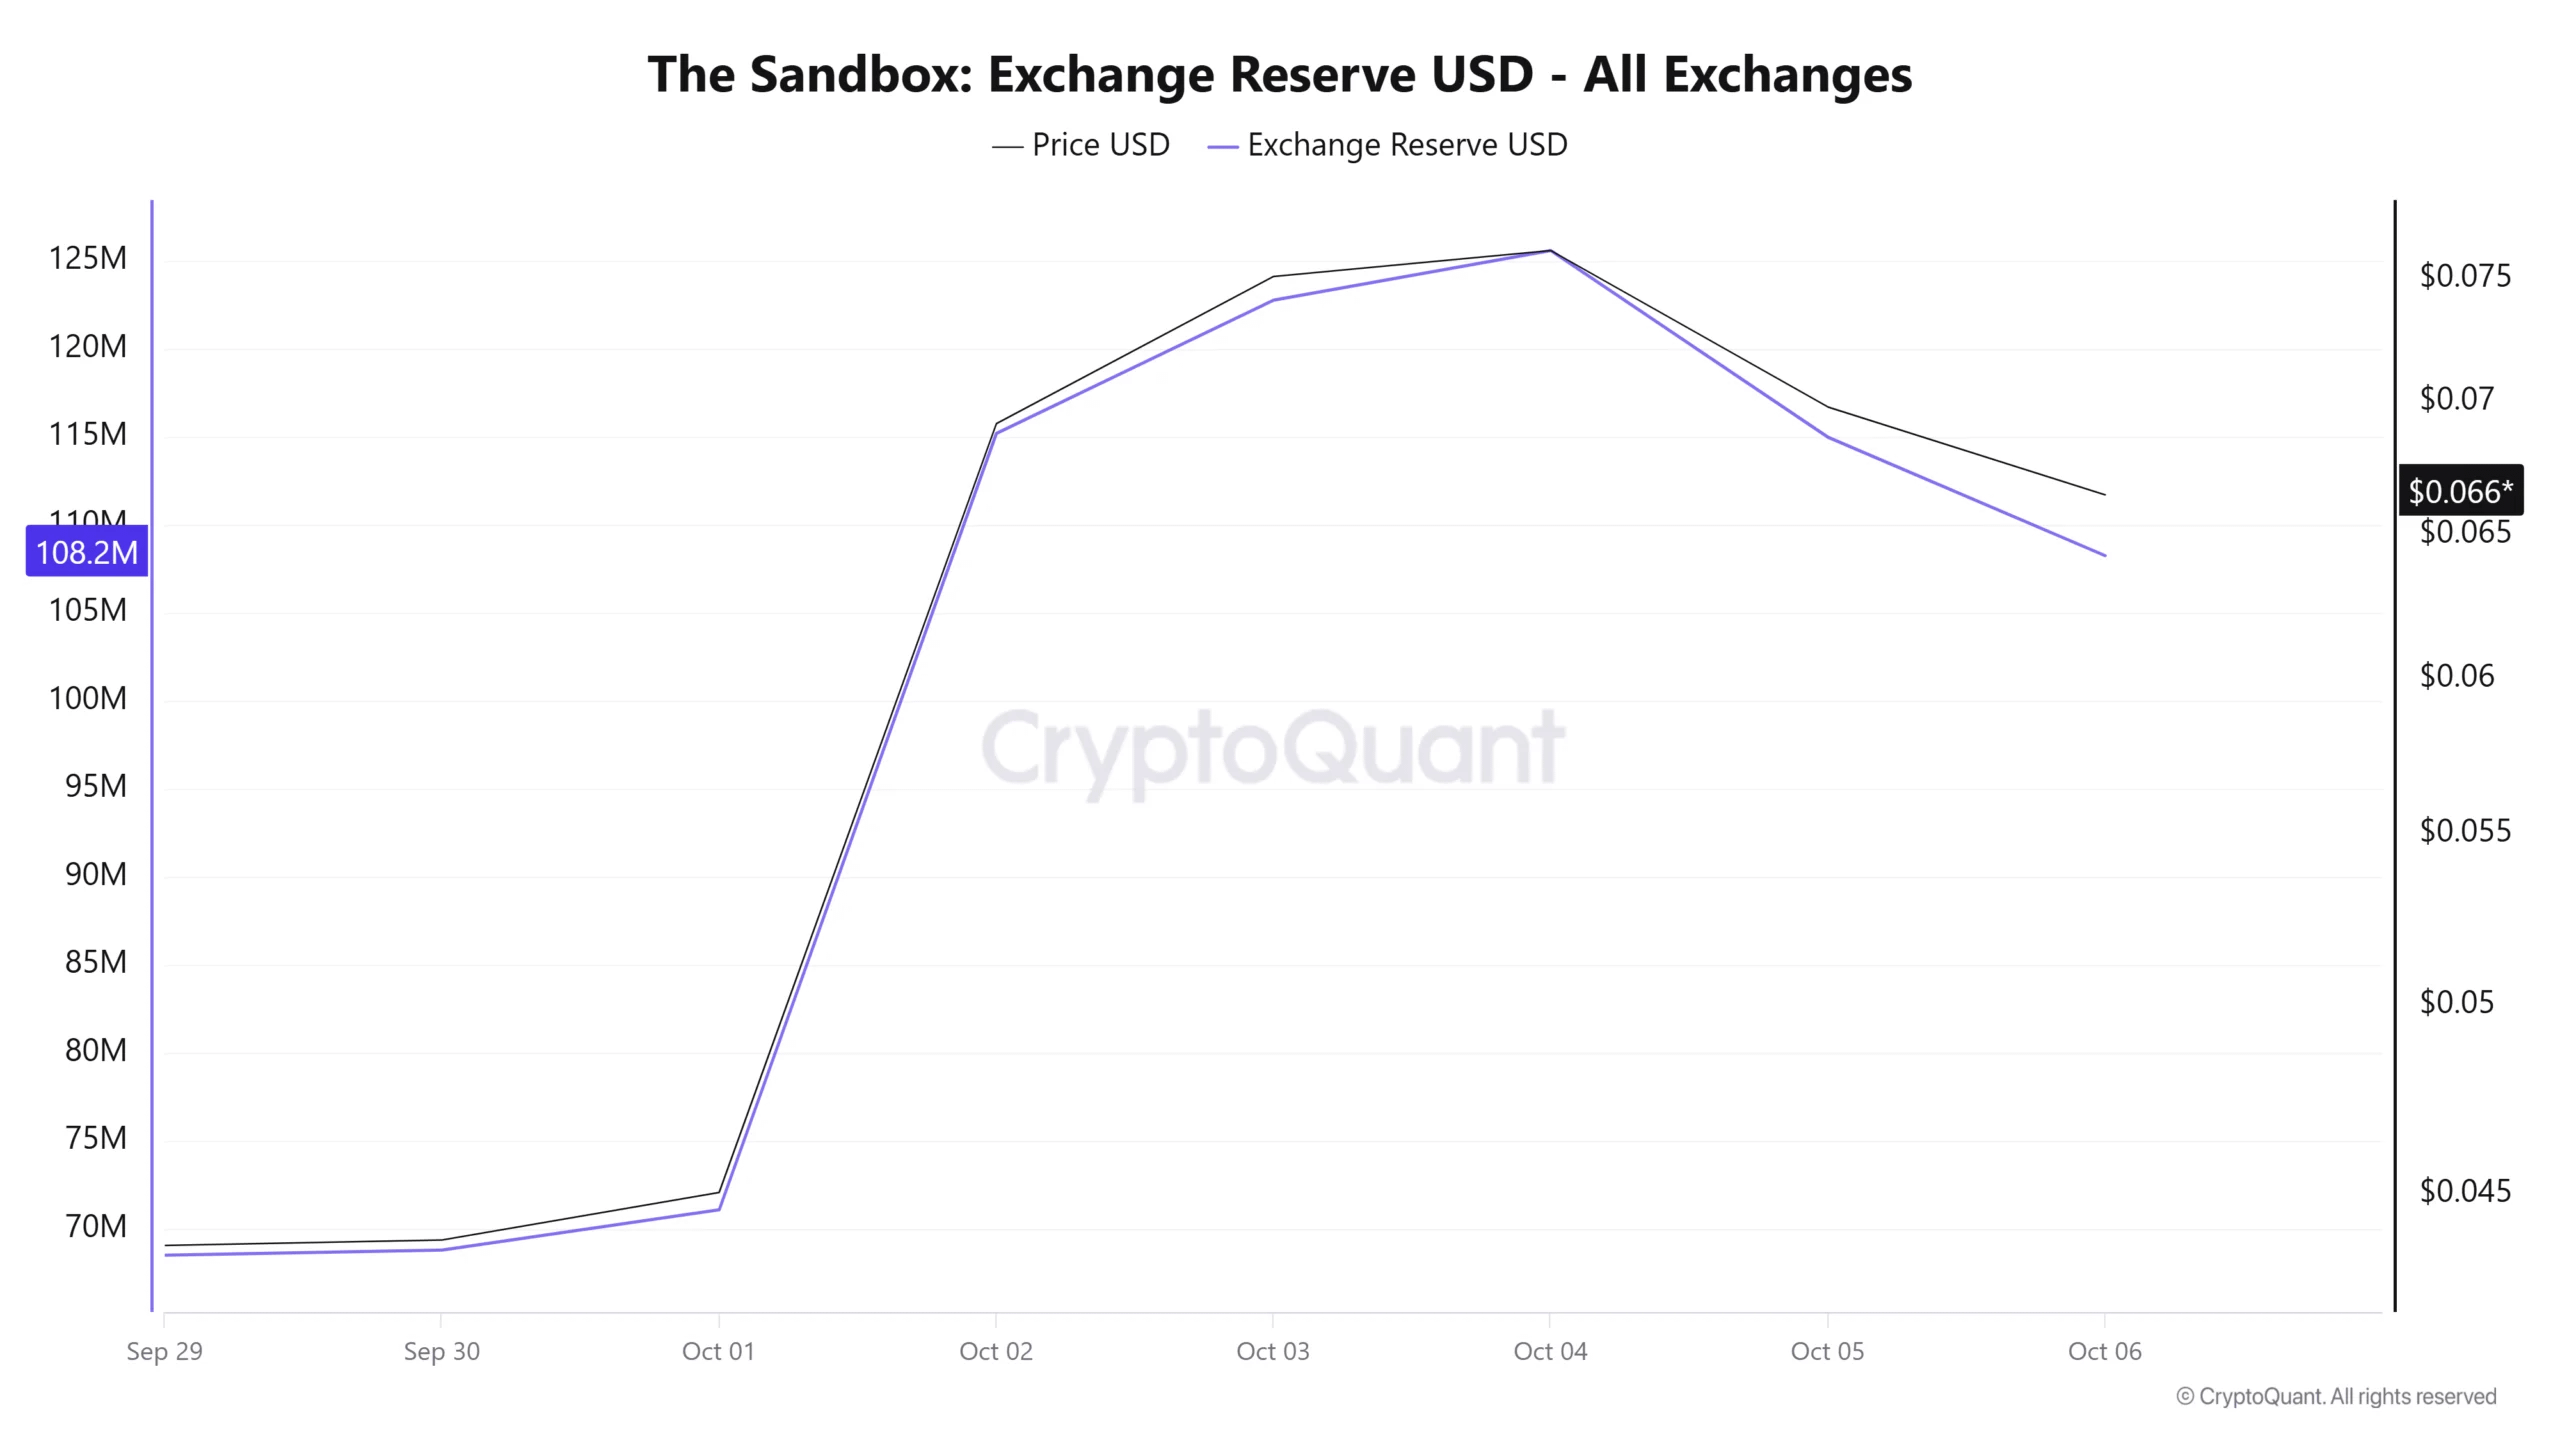
SAND selling pressure has eased significantly compared with the start of the month, while more than 17 million tokens left exchanges over the past two days. This suggests spot buying during the price pullback and cooling profit-taking pressure.
Net Volume was nearly flat. The amount of SAND sold at the time of recording was far below the peak recorded on October 2.
Metric Time or period SAND amount Selling volume At the time of recording 3.54 million Peak selling volume October 2 46.32 million Exchange reserves First four days of October Increased from 71 million to 125 million Tokens leaving exchanges Past two days More than 17 million
SAND reserves on exchanges rose sharply during the first four days of the month before token outflows began. This shift is consistent with the view that profit-taking pressure has eased, although the price remains affected by the gaming sector's correction.
 Source: CryptoQuant
SAND derivatives positioning is mixed across trader groups
Retail traders lean toward Long positions on Binance, OKX, and Bybit, while “smart money” is tilted bearish. Long and Short volumes in the futures market are relatively balanced.
Data group Exchange or scope Data Retail trader Long/Short ratio Binance 1.12 Retail trader Long/Short ratio OKX 1.47 Retail trader Long/Short ratio Bybit 1.41 Long volume Futures market, past four hours $22 million, accounting for 53.5% Short volume Futures market, past four hours $19 million
Whale data is inconsistent: the Long/Short ratio was recorded above 1.31 on Binance and OKX, but OKX also showed a reading of 0.98, indicating a bearish tilt. Therefore, the direction of whale positioning on OKX remains unclear.
 Source: CoinGlass
SAND's descending price channel and key technical levels
SAND is trading in a descending channel, with the next demand zone around $0.06 if the price fails to break above the upper boundary. The channel could be a bullish flag pattern, but the short-term structure remains weak.
The Bull Bear Power (BBP) indicator is in the red zone, reflecting sellers' advantage. SAND is trading above the channel's midpoint, but the continuation of an uptrend depends on a breakout above the upper boundary.
 Source: SAND/USDT on TradingView
Technical scenario Key SAND price level SAND fails to break above the upper boundary of the descending channel Demand zone around $0.06 SAND breaks above the upper boundary of the descending channel $0.085 SAND breaks below the lower boundary of the descending channel $0.043
SAND's decline could continue if the gaming sector's correction persists. The price levels above represent scenarios dependent on the direction of a channel breakout; they are not confirmed moves.
Summary
SAND is under pressure from the gaming sector's correction and a weak short-term price structure. Lower selling volume and token outflows from exchanges present conflicting signals, while derivatives positioning remains mixed; the direction of a price-channel breakout is still key to watch.
Source: https://tintucbitcoin.com/sand-giam-10-mo-hinh-co-tang-gia-co-tru-vung-truoc-dot-ban-thao/
Thank you for reading this article!
Like, comment, and follow TinTucBitcoin to stay up to date with the latest cryptocurrency market news and not miss any important updates!
$BTC $ETH $BNB $XRP $SOL