🚀 BITCOIN PULLS BACK TOWARD THE KEY SUPPORT ZONE! ⚡
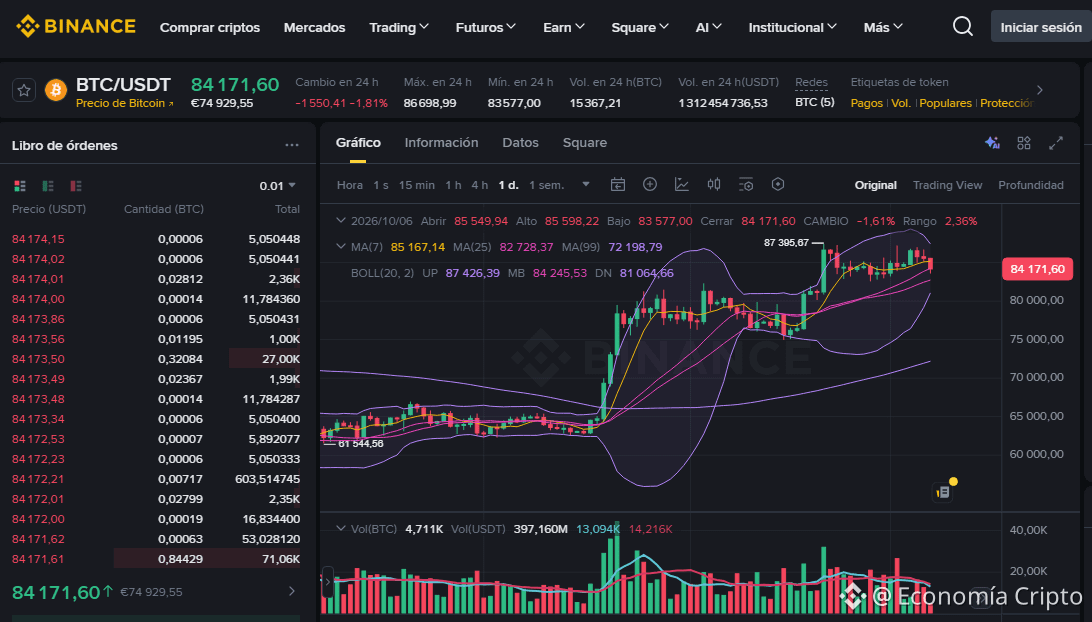
The BTC/USDT pair is trading at 84.171,60, recording a change of -1,81% over the last 24 hours. The daily session shows an open of 85.549,94, a high of 85.598,22, a low of 83.577,00, and a close of 84.171,60 (-1,61%), reflecting a healthy correction within its current price action.
🔍 Trend and Indicator Analysis
Trend: Short-term corrective movement seeking support in areas of technical confluence following recent highs.
Moving Averages: The price is temporarily trading below the MA(7) (85.167,14), but remains firmly supported by the MA(25) (82.728,37) and the long-term primary trend marked by the MA(99) (72.198,79).
Bollinger Bands: The price is testing the middle band (MB) at 84.245,53, with the upper band (UP) at 87.426,39 and the lower band (DN) at 81.064,66.
Key Levels: Immediate support is at 83.577,00 (24-hour low), while the main resistance to break is at 86.698,99 (24-hour high).
💡 Trading Strategy: Buy or Sell?
Buy (Long)?: Pullbacks toward the support zone and the Bollinger middle band present attractive tactical accumulation points, always trading with strict risk management.
Sell (Short)?: Selling at this level carries elevated risks due to the strength of lower support levels; bearish positions would only be justified after a significant break below key levels.
#Bitcoin #BTC #CryptoTrading
Lord, bless and prosper whoever trades here, in the name of Jesus, for your word says: "The silver is mine, and the gold is mine, says the LORD of hosts." Haggai 2:8 KJV -
$BTC
The BTC/USDT pair is trading at 84.171,60, recording a change of -1,81% over the last 24 hours. The daily session shows an open of 85.549,94, a high of 85.598,22, a low of 83.577,00, and a close of 84.171,60 (-1,61%), reflecting a healthy correction within its current price action.
🔍 Trend and Indicator Analysis
Trend: Short-term corrective movement seeking support in areas of technical confluence following recent highs.
Moving Averages: The price is temporarily trading below the MA(7) (85.167,14), but remains firmly supported by the MA(25) (82.728,37) and the long-term primary trend marked by the MA(99) (72.198,79).
Bollinger Bands: The price is testing the middle band (MB) at 84.245,53, with the upper band (UP) at 87.426,39 and the lower band (DN) at 81.064,66.
Key Levels: Immediate support is at 83.577,00 (24-hour low), while the main resistance to break is at 86.698,99 (24-hour high).
💡 Trading Strategy: Buy or Sell?
Buy (Long)?: Pullbacks toward the support zone and the Bollinger middle band present attractive tactical accumulation points, always trading with strict risk management.
Sell (Short)?: Selling at this level carries elevated risks due to the strength of lower support levels; bearish positions would only be justified after a significant break below key levels.
#Bitcoin #BTC #CryptoTrading
Lord, bless and prosper whoever trades here, in the name of Jesus, for your word says: "The silver is mine, and the gold is mine, says the LORD of hosts." Haggai 2:8 KJV -
$BTC