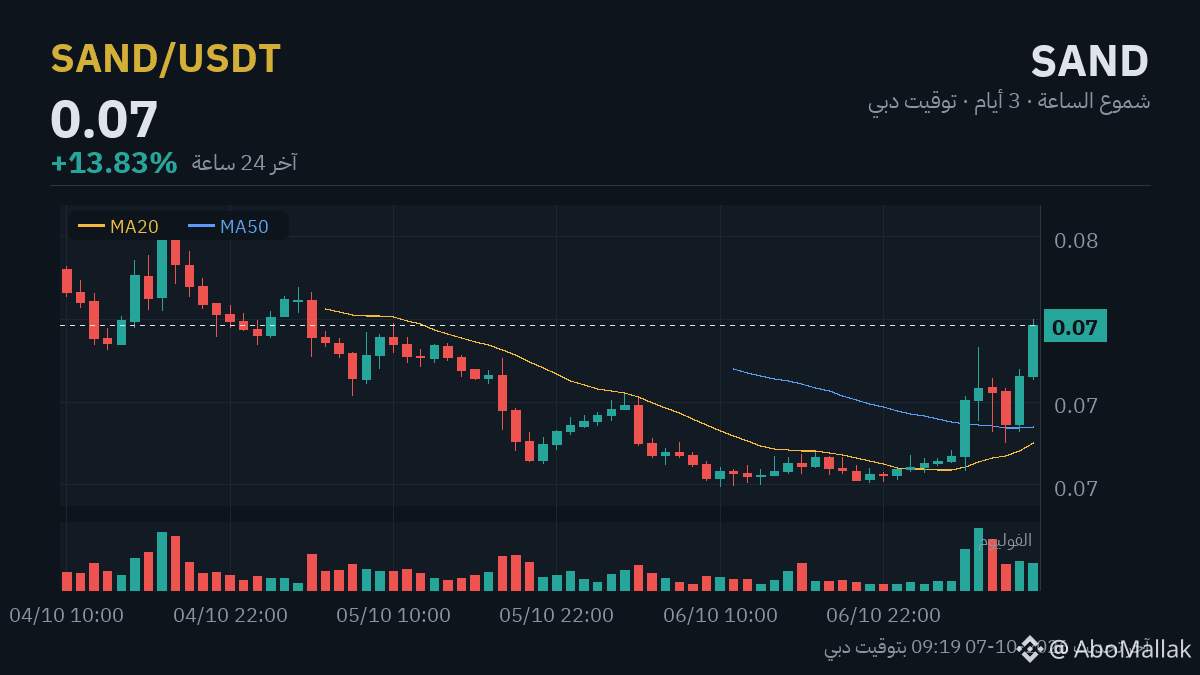

🚀 Pump watch: $SAND up +13.8% in 24 hours
Momentum strength: 78/100
✅ $16M liquidity | ✅ Holding 99% of its peak | ✅ Volume is confirming the move
▪️ Current price: $0.07464
📊 Key levels guiding the move:
▪️ Holding above $0.06436 = the move is still intact
▪️ Breaking above $0.06966 = the door remains open for continuation
▪️ Falling back below $0.065563 (the start of the wave) = consider it over
📊 SAND price movement watch
The coin rose +13.8% over 24 hours, with liquidity reaching $16 million and the current price at $0.07464.
**Continuation scenario:** If the price can hold above the nearby resistance at $0.06966 and turn it into support, that would signal that upward momentum is still in play and incoming liquidity could carry the move to higher levels.
**Move is over scenario:** If the price reverses and breaks below the support zone at $0.06436, that would indicate the upward wave has lost strength and selling pressure is starting to take over again.
Tracking liquidity and volume over the next few hours will determine which scenario is more likely to play out.
If you're planning to enter after a move like this, buying in stages can protect you from putting it all in at the top:
1- First tranche if it pulls back to $0.072371
2- Second at $0.070102
3- Third at $0.067833
If it closes below $0.065563, the plan has failed and you exit. Your loss at that point would be around 6% of the amount, not the whole thing.
The exit level is the start of the wave mentioned above — below it, consider the move over.
Do your own research (DYOR) — this is a risk-management approach, not a recommendation.
Will the move continue, or is this the top? The chart is right in front of you 👇 $SAND
⚠️ These pump moves can swing violently in both directions — chasing them late is riskier than missing out.
📉 The market around it: $BTC down -1.7% over the same hours.
#SAND #Altcoins #Cryptocurrencies
⚠️ Educational content for monitoring purposes — not investment advice. You are responsible for your own decisions.
Momentum strength: 78/100
✅ $16M liquidity | ✅ Holding 99% of its peak | ✅ Volume is confirming the move
▪️ Current price: $0.07464
📊 Key levels guiding the move:
▪️ Holding above $0.06436 = the move is still intact
▪️ Breaking above $0.06966 = the door remains open for continuation
▪️ Falling back below $0.065563 (the start of the wave) = consider it over
📊 SAND price movement watch
The coin rose +13.8% over 24 hours, with liquidity reaching $16 million and the current price at $0.07464.
**Continuation scenario:** If the price can hold above the nearby resistance at $0.06966 and turn it into support, that would signal that upward momentum is still in play and incoming liquidity could carry the move to higher levels.
**Move is over scenario:** If the price reverses and breaks below the support zone at $0.06436, that would indicate the upward wave has lost strength and selling pressure is starting to take over again.
Tracking liquidity and volume over the next few hours will determine which scenario is more likely to play out.
If you're planning to enter after a move like this, buying in stages can protect you from putting it all in at the top:
1- First tranche if it pulls back to $0.072371
2- Second at $0.070102
3- Third at $0.067833
If it closes below $0.065563, the plan has failed and you exit. Your loss at that point would be around 6% of the amount, not the whole thing.
The exit level is the start of the wave mentioned above — below it, consider the move over.
Do your own research (DYOR) — this is a risk-management approach, not a recommendation.
Will the move continue, or is this the top? The chart is right in front of you 👇 $SAND
⚠️ These pump moves can swing violently in both directions — chasing them late is riskier than missing out.
📉 The market around it: $BTC down -1.7% over the same hours.
#SAND #Altcoins #Cryptocurrencies
⚠️ Educational content for monitoring purposes — not investment advice. You are responsible for your own decisions.