【$SOL at a glance: Hot news and technicals converge—is it bearish or a false breakout?】
【Hot news】
This CoinDesk flash report has drawn considerable discussion in the community, and the market reacted quickly.
“Solana Foundation unveils a program to settle institutional trades in seconds. JPMorgan gave input” — CoinDesk reports that the Solana Foundation launched an open-source program that lets institutions settle trades in seconds, not days.
The biggest risk with event-driven market moves is that sentiment gets overextended, so whether key levels hold matters more than the news itself.
【Market snapshot】
$SOL is currently at 118.13, down 1.69% over 24 hours, with 24-hour trading volume of approximately 218.2M USDT.
【Technical breakdown】
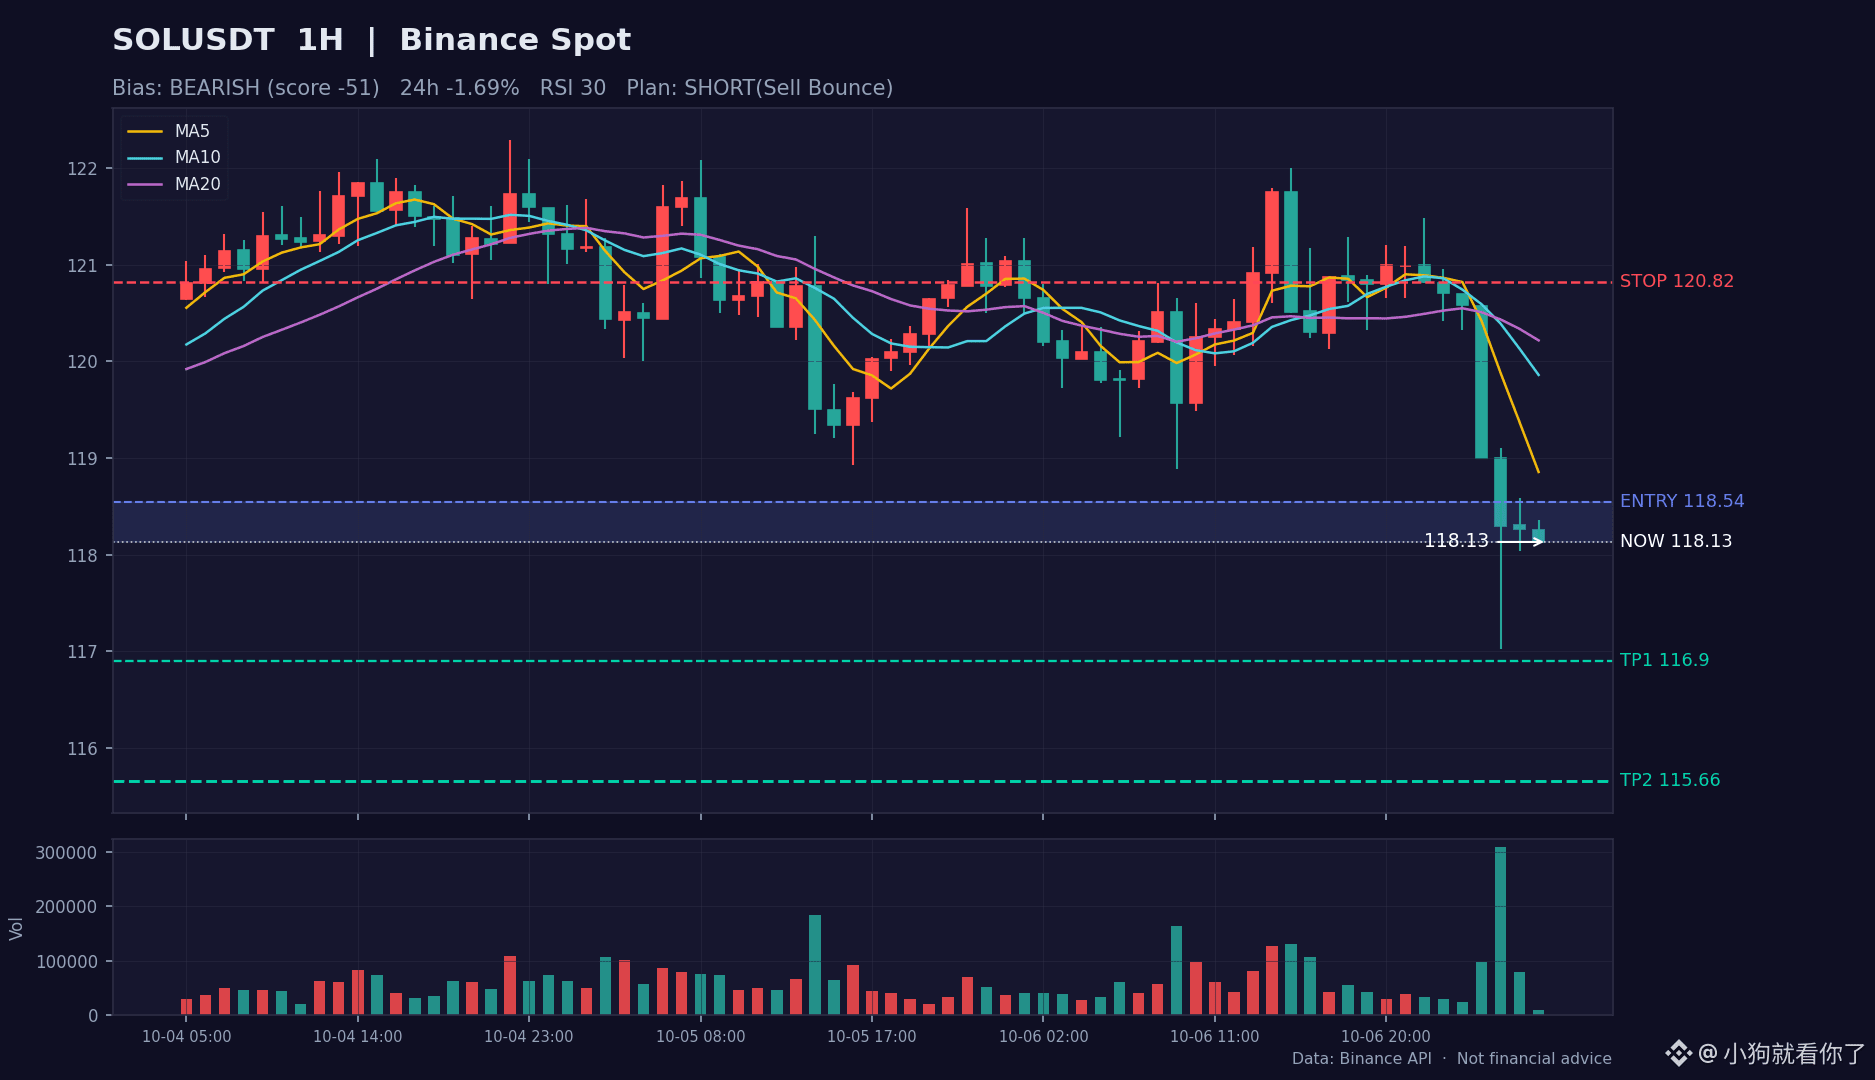
· Moving averages: MA5<MA10<MA20<MA60, in a bearish alignment; rebounds are likely to face resistance from the moving averages
· Momentum: The MACD fast line is below zero, and the green histogram bars remain; bearish momentum may not have run its course. RSI(30) is already in oversold territory, so a technical rebound could occur at any time
· Pattern: Price is tracking along the lower Bollinger Band, and conditions for an oversold bounce are building; volume is contracting (0.1 times the average), so directional signals should be treated with caution in this low-volume environment
【Directional view】
Overall score: -51/100. The structure is tilted bearish: with moving-average resistance and weakening momentum, a short near the upper end of the entry zone on a rebound offers a good defensive setup. First target is below; a high-volume reclaim of the stop level would invalidate the bearish thesis.
【Trade plan reference】
· Approach: Short the rebound
· Entry zone: 118.13 ~ 118.54
· Take profit: First target 116.90, second target 115.66
· Stop loss: 120.82
· Position size: Small, 5%-10%; strictly exit if the stop level is breached
· Chart: Candlestick analysis chart included with the post (1-hour chart; red for up, green for down; entry zone/take-profit/stop-loss levels marked with colored lines)
【Risk warning】Data reflects probabilities, not a script. If any planned level is breached, exit first and reassess the thesis.
The above is for personal review and technical analysis only and does not constitute investment advice. DYOR.
$SOL #SOL #加密货币 #MarketAnalysis
【Hot news】
This CoinDesk flash report has drawn considerable discussion in the community, and the market reacted quickly.
“Solana Foundation unveils a program to settle institutional trades in seconds. JPMorgan gave input” — CoinDesk reports that the Solana Foundation launched an open-source program that lets institutions settle trades in seconds, not days.
The biggest risk with event-driven market moves is that sentiment gets overextended, so whether key levels hold matters more than the news itself.
【Market snapshot】
$SOL is currently at 118.13, down 1.69% over 24 hours, with 24-hour trading volume of approximately 218.2M USDT.
【Technical breakdown】
· Moving averages: MA5<MA10<MA20<MA60, in a bearish alignment; rebounds are likely to face resistance from the moving averages
· Momentum: The MACD fast line is below zero, and the green histogram bars remain; bearish momentum may not have run its course. RSI(30) is already in oversold territory, so a technical rebound could occur at any time
· Pattern: Price is tracking along the lower Bollinger Band, and conditions for an oversold bounce are building; volume is contracting (0.1 times the average), so directional signals should be treated with caution in this low-volume environment
【Directional view】
Overall score: -51/100. The structure is tilted bearish: with moving-average resistance and weakening momentum, a short near the upper end of the entry zone on a rebound offers a good defensive setup. First target is below; a high-volume reclaim of the stop level would invalidate the bearish thesis.
【Trade plan reference】
· Approach: Short the rebound
· Entry zone: 118.13 ~ 118.54
· Take profit: First target 116.90, second target 115.66
· Stop loss: 120.82
· Position size: Small, 5%-10%; strictly exit if the stop level is breached
· Chart: Candlestick analysis chart included with the post (1-hour chart; red for up, green for down; entry zone/take-profit/stop-loss levels marked with colored lines)
【Risk warning】Data reflects probabilities, not a script. If any planned level is breached, exit first and reassess the thesis.
The above is for personal review and technical analysis only and does not constitute investment advice. DYOR.
$SOL #SOL #加密货币 #MarketAnalysis