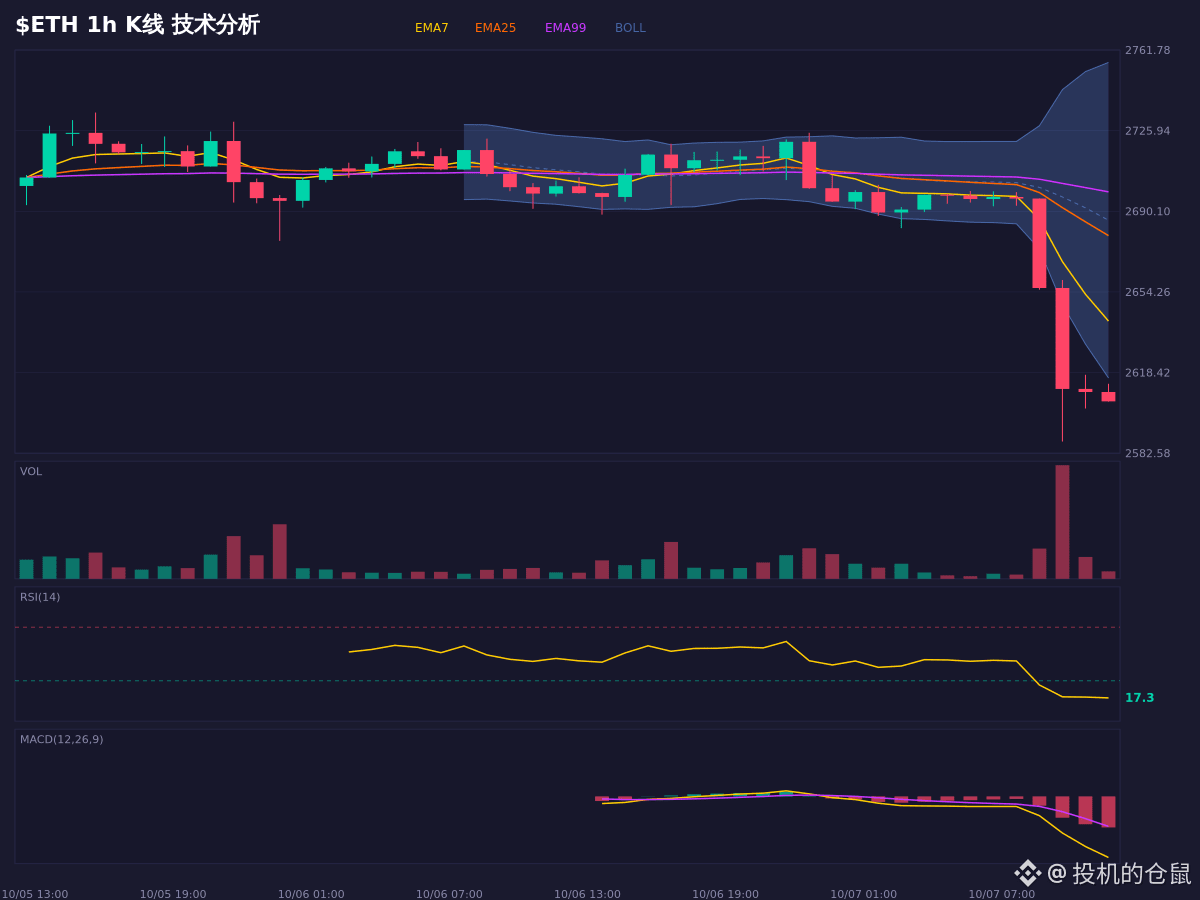
$ETH This sell-off has been pretty severe. RSI is down to 17, clearly in oversold territory, but the moving averages are still bearishly aligned, so this bounce may just be a technical correction.
The MACD histogram is shrinking, indicating that bearish momentum is weakening, but there’s no reversal signal yet. Price has broken below the lower Bollinger Band, making a short-term bounce likely, but whether it can continue depends on whether price can hold above EMA7 (2641.41).
If the rebound is capped at 2741.31, the bearish structure may persist; if price holds above 2679.49, it may have a chance to test 2700. The short-term trading range is roughly 2616–2756.
For market observation and conditional analysis only; this is not a record of trading activity.
$ETH #熊市 #牛市 #Market Sentiment
The MACD histogram is shrinking, indicating that bearish momentum is weakening, but there’s no reversal signal yet. Price has broken below the lower Bollinger Band, making a short-term bounce likely, but whether it can continue depends on whether price can hold above EMA7 (2641.41).
If the rebound is capped at 2741.31, the bearish structure may persist; if price holds above 2679.49, it may have a chance to test 2700. The short-term trading range is roughly 2616–2756.
For market observation and conditional analysis only; this is not a record of trading activity.
$ETH #熊市 #牛市 #Market Sentiment