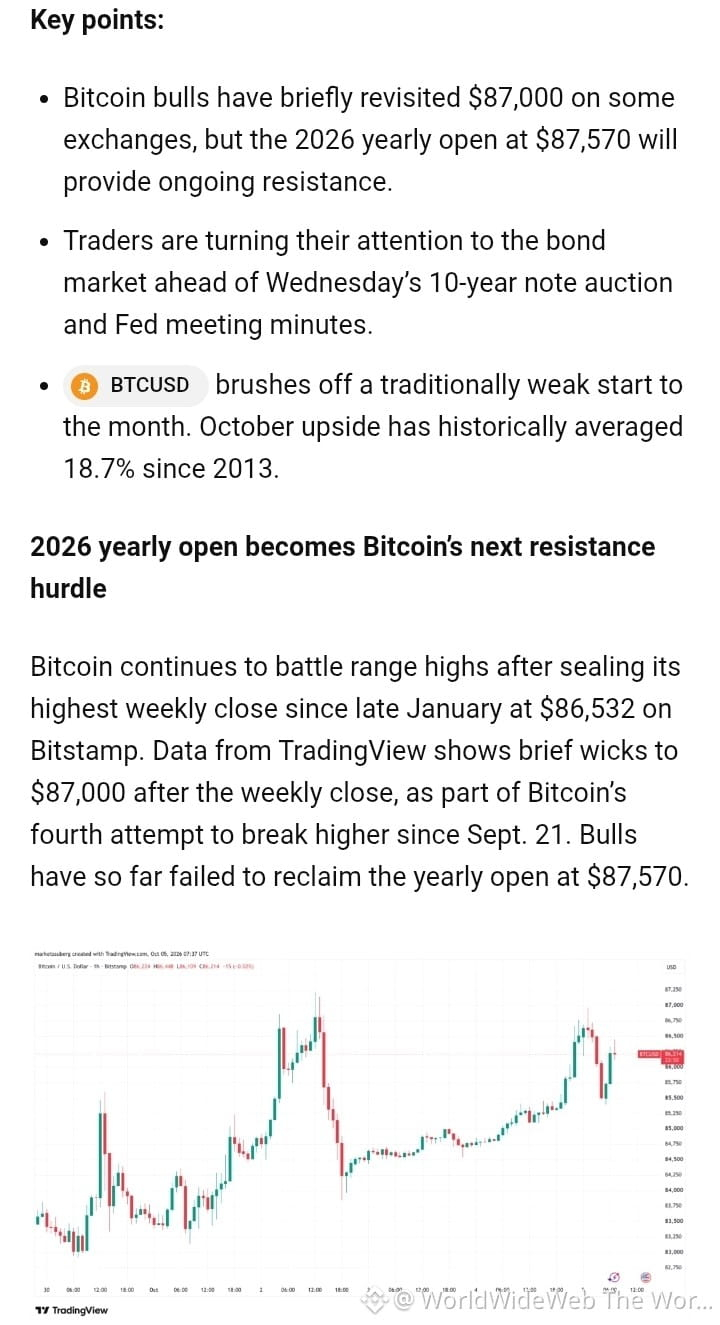
#BitcoinTargets2026OpenAt$87570 Bitcoin’s price is fighting a crucial technical battle as it attempts to reclaim $87,570, a level that marks the exact annual opening price for 2026. In early October, the market’s leading cryptocurrency posted its best weekly close in eight months at $86,532, making several brief pushes into the $87,000 zone. According to market analyses shared on Binance Square, consolidating a decisive breakout above this psychological threshold would officially turn the annual candle green, opening the way to a bullish structure with initial targets at $93,700. However, traders remain cautious and are closely monitoring macro support at $82,500, particularly amid external factors such as volatility in the U.S. bond market and the upcoming Federal Reserve (Fed) minutes. These events will determine whether the seasonal phenomenon known as “Uptober” gains enough momentum to confirm the breakout.
The following on-chain market charts illustrate the asset’s behavior and the key resistance levels it faces as it attempts to consolidate the annual open:
• The first technical chart details current price action, compressed below $87,570, and daily volatility indicators as the price approaches the resistance zone.
• The second structural analysis maps projections and critical liquidity zones distributed across this period’s trading channel.
$BTC
• Analyze liquidation heatmaps around $83,700.
• Assess the impact of net capital flows into spot ETFs on the defense of this support level.
• Review Bitcoin dominance’s historical behavior when facing annual resistance levels.
The following on-chain market charts illustrate the asset’s behavior and the key resistance levels it faces as it attempts to consolidate the annual open:
• The first technical chart details current price action, compressed below $87,570, and daily volatility indicators as the price approaches the resistance zone.
• The second structural analysis maps projections and critical liquidity zones distributed across this period’s trading channel.
$BTC
• Analyze liquidation heatmaps around $83,700.
• Assess the impact of net capital flows into spot ETFs on the defense of this support level.
• Review Bitcoin dominance’s historical behavior when facing annual resistance levels.