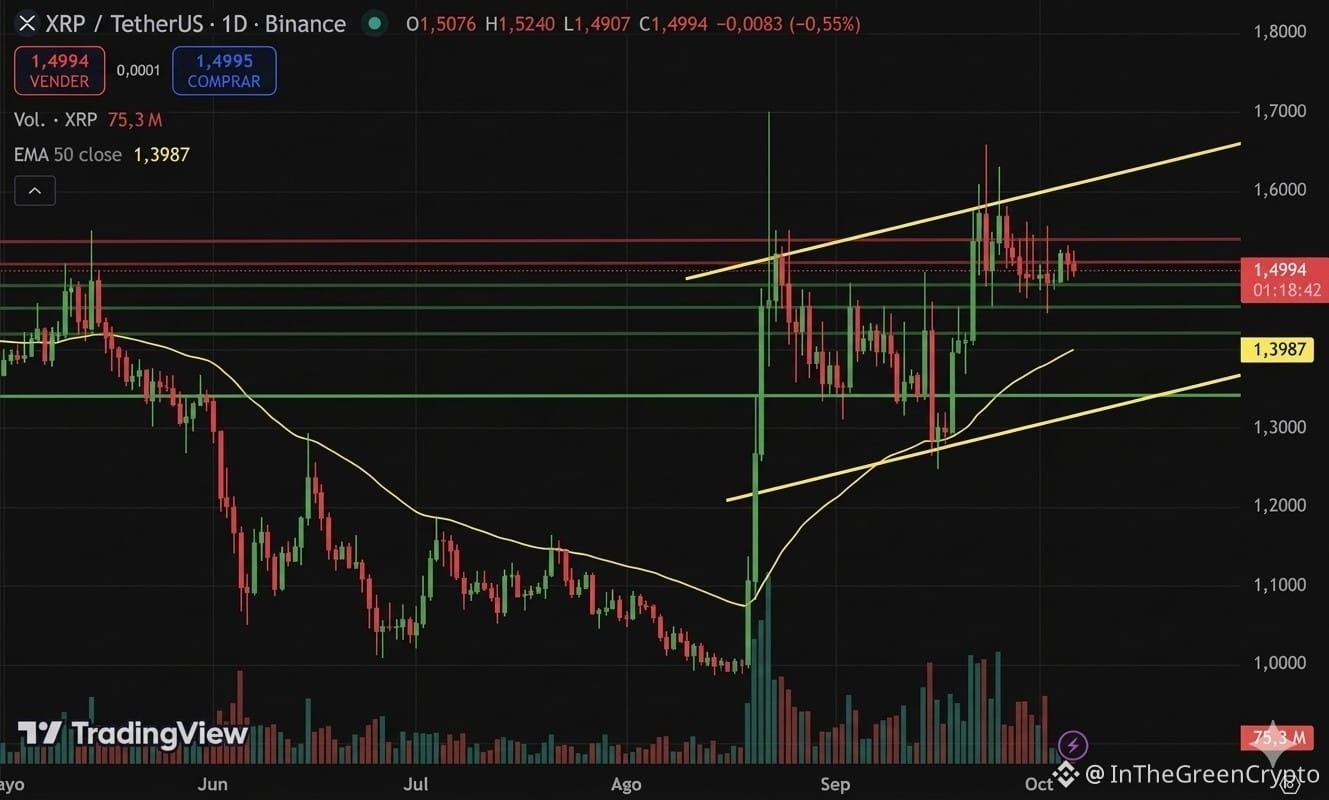
XRP daily chart: Support and resistance before the next big move 📊💥
A few days ago, I mentioned that $XRP was within a rising channel structure. I was expecting a 4th bounce; however, after taking a closer look, I realized there are intermediate support and resistance levels, which are making the move slower than expected.
🔍 What is the chart telling us today?
On the chart, we can see that over the past few days, the price has tested the resistance at 1.5095 USDT but has not managed to break above it with strength (leaving only upper wicks and no candle bodies).
The same is happening at the key resistance at 1.5380: the price is reacting with rejection wicks, confirming that selling pressure remains strong in this upper zone.
📉 Key levels to watch over the next few days
Since bullish momentum has not managed to consolidate above resistance, we are likely to see an attempt to test the lower support levels:
⚠️🟢First critical support (1.4838): This is the immediate support. A break and candle close below this level would confirm a loss of short-term momentum.
⚠️🟢Second key support (1.4526): If the first level breaks, this is the next support zone where we would look for a stronger reaction or buying volume.
💡 Trading conclusion
The market doesn't always move in a straight line. These congestion zones between intermediate support and resistance require patience while we wait for clear confirmation before looking for the next direction.
👇 What do you think? Will we see a downside break toward the bottom of the channel, or will $XRP end up breaking upward?
🔔 If this analysis helped you map out strategies today, hit 'Follow' so you don't miss the next market updates. 🚀
Disclaimer: This is not financial advice. Do your own research. Educational content. Trade at your own risk (DYOR)
$XRP #Trading #TechnicalAnalysis #BinanceSquare
A few days ago, I mentioned that $XRP was within a rising channel structure. I was expecting a 4th bounce; however, after taking a closer look, I realized there are intermediate support and resistance levels, which are making the move slower than expected.
🔍 What is the chart telling us today?
On the chart, we can see that over the past few days, the price has tested the resistance at 1.5095 USDT but has not managed to break above it with strength (leaving only upper wicks and no candle bodies).
The same is happening at the key resistance at 1.5380: the price is reacting with rejection wicks, confirming that selling pressure remains strong in this upper zone.
📉 Key levels to watch over the next few days
Since bullish momentum has not managed to consolidate above resistance, we are likely to see an attempt to test the lower support levels:
⚠️🟢First critical support (1.4838): This is the immediate support. A break and candle close below this level would confirm a loss of short-term momentum.
⚠️🟢Second key support (1.4526): If the first level breaks, this is the next support zone where we would look for a stronger reaction or buying volume.
💡 Trading conclusion
The market doesn't always move in a straight line. These congestion zones between intermediate support and resistance require patience while we wait for clear confirmation before looking for the next direction.
👇 What do you think? Will we see a downside break toward the bottom of the channel, or will $XRP end up breaking upward?
🔔 If this analysis helped you map out strategies today, hit 'Follow' so you don't miss the next market updates. 🚀
Disclaimer: This is not financial advice. Do your own research. Educational content. Trade at your own risk (DYOR)
$XRP #Trading #TechnicalAnalysis #BinanceSquare