$INJ INJ/USDT Analysis (1D)
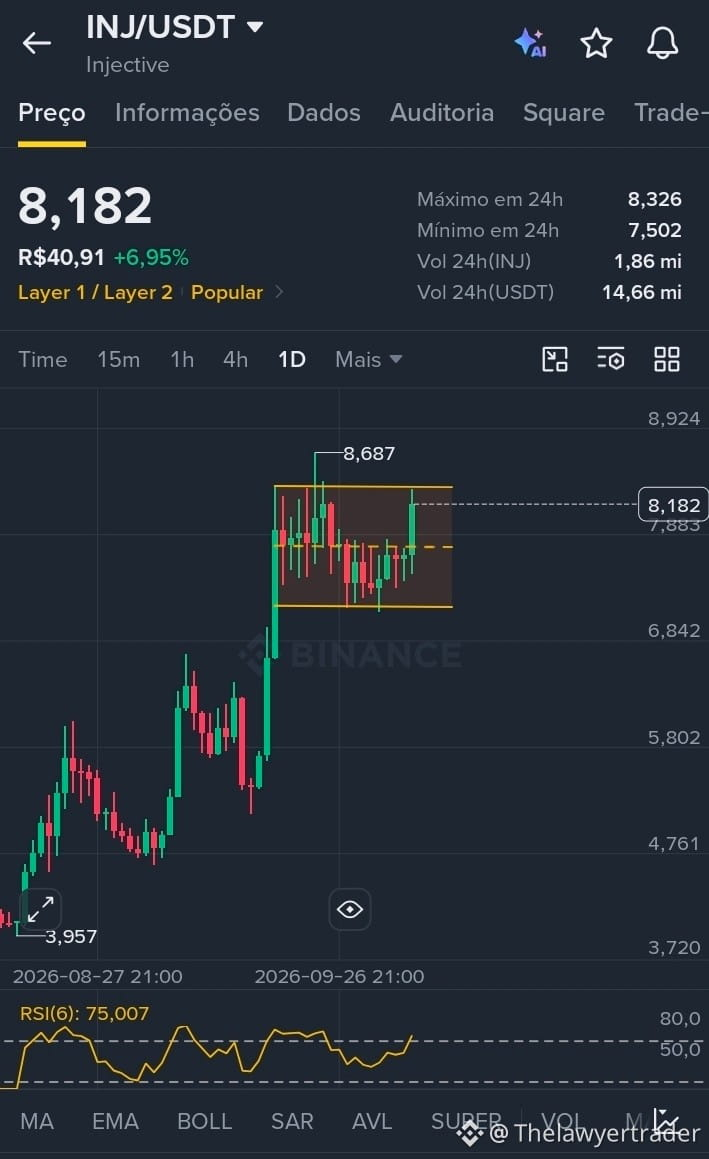
INJ has been in a strong uptrend since its low of 3.957, posting significant gains. The current price is 8.182 USDT, up +6.95% over the past 24 hours.
Main support: 7.000 USDT (base of the sideways consolidation zone)
Main resistance: 8.687 USDT (recent peak, top of the consolidation range)
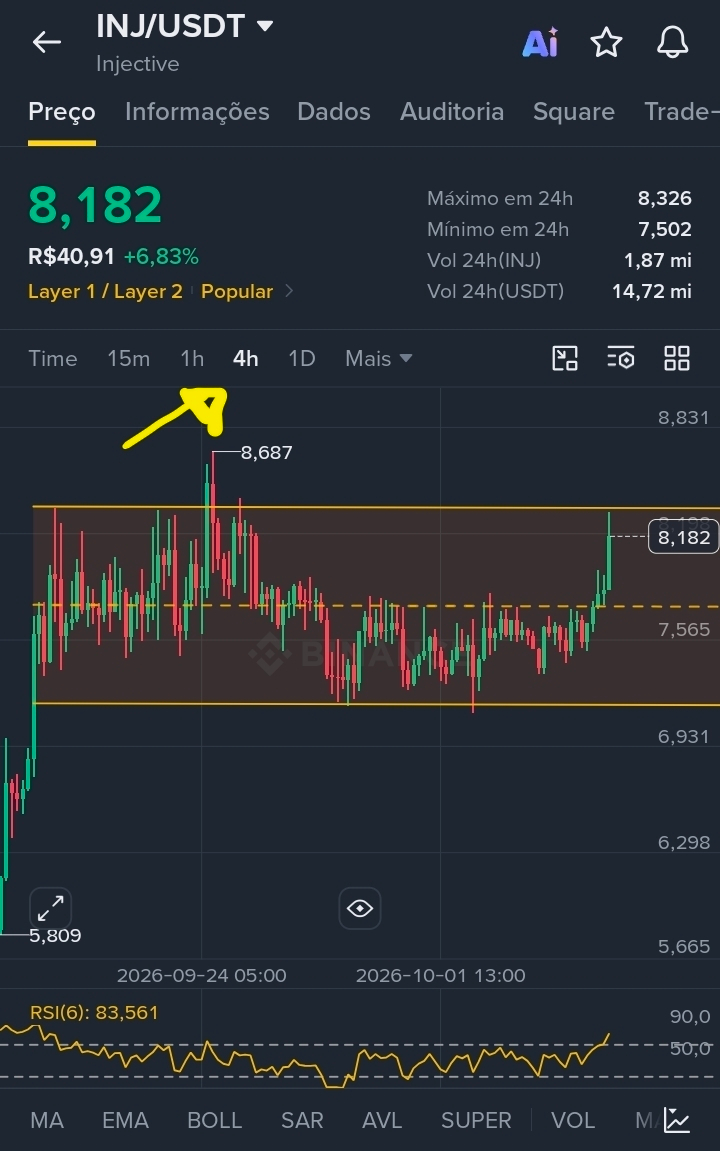
Verifiable chart pattern: The asset formed a sideways consolidation (box) after its strong upward move, and the latest candle is testing the top of this range. A potential bullish continuation pattern could emerge if the price breaks above 8.687 and holds there. However, the RSI(6) at 75 indicates short-term overbought conditions, suggesting caution due to possible corrections or further sideways movement before a new directional move.
Volume: 1.86 million INJ traded in 24h (14.66 million USDT), indicating active market interest.
⚠️ This analysis is for technical and informational purposes only and does not constitute investment advice.
#Injective🔥 $INJ
INJ has been in a strong uptrend since its low of 3.957, posting significant gains. The current price is 8.182 USDT, up +6.95% over the past 24 hours.
Main support: 7.000 USDT (base of the sideways consolidation zone)
Main resistance: 8.687 USDT (recent peak, top of the consolidation range)
Verifiable chart pattern: The asset formed a sideways consolidation (box) after its strong upward move, and the latest candle is testing the top of this range. A potential bullish continuation pattern could emerge if the price breaks above 8.687 and holds there. However, the RSI(6) at 75 indicates short-term overbought conditions, suggesting caution due to possible corrections or further sideways movement before a new directional move.
Volume: 1.86 million INJ traded in 24h (14.66 million USDT), indicating active market interest.
⚠️ This analysis is for technical and informational purposes only and does not constitute investment advice.
#Injective🔥 $INJ