$BTC
BTC/USDT
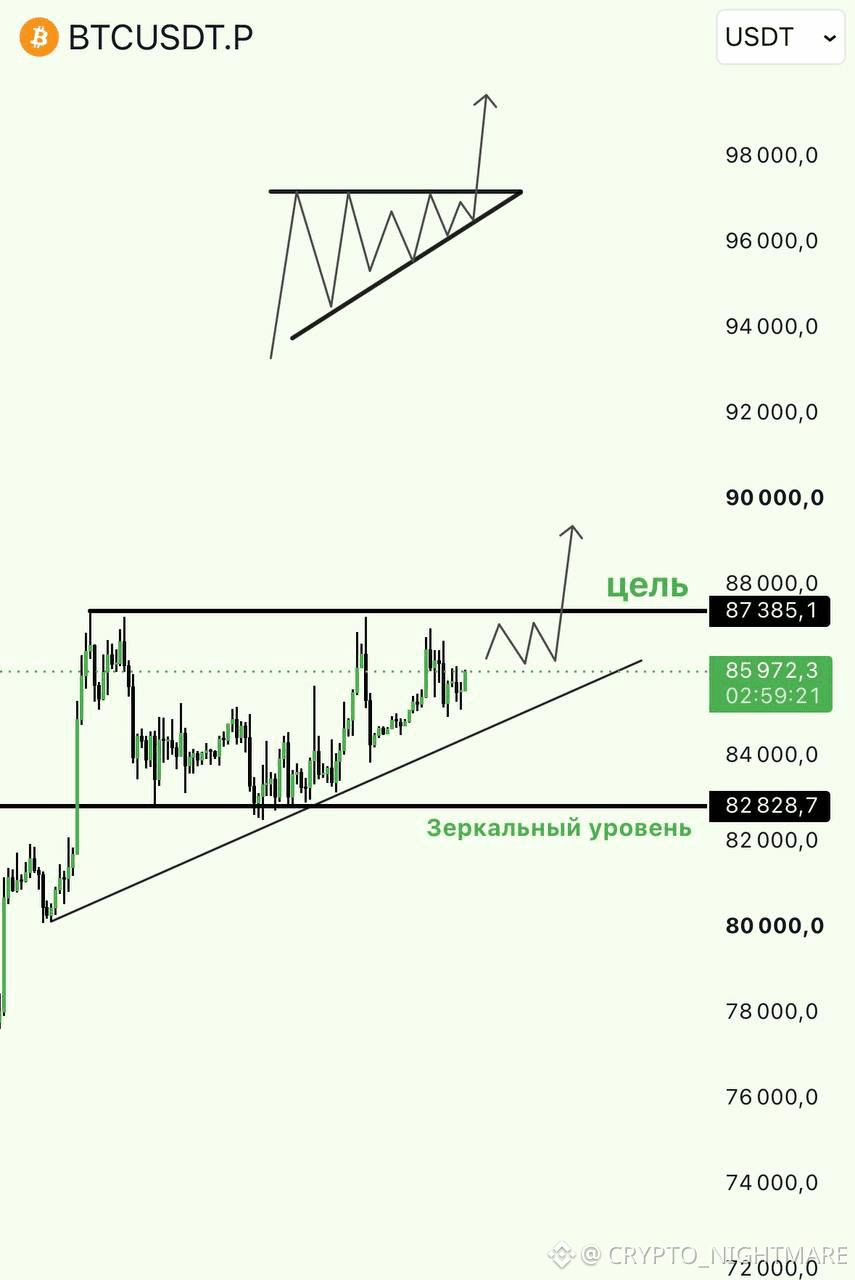
The chart shows a standard triangle pattern tightening toward the highs at $87,400. There have already been 4 touches of the level, and the pattern is still forming. This is where stops are accumulating in this sideways range, setting the stage for an impulse move.
Below is a mirrored support level, which previously acted as resistance at $82,800. A break below it could also trigger an impulse move. But I still lean toward longs.
BTC/USDT
The chart shows a standard triangle pattern tightening toward the highs at $87,400. There have already been 4 touches of the level, and the pattern is still forming. This is where stops are accumulating in this sideways range, setting the stage for an impulse move.
Below is a mirrored support level, which previously acted as resistance at $82,800. A break below it could also trigger an impulse move. But I still lean toward longs.