

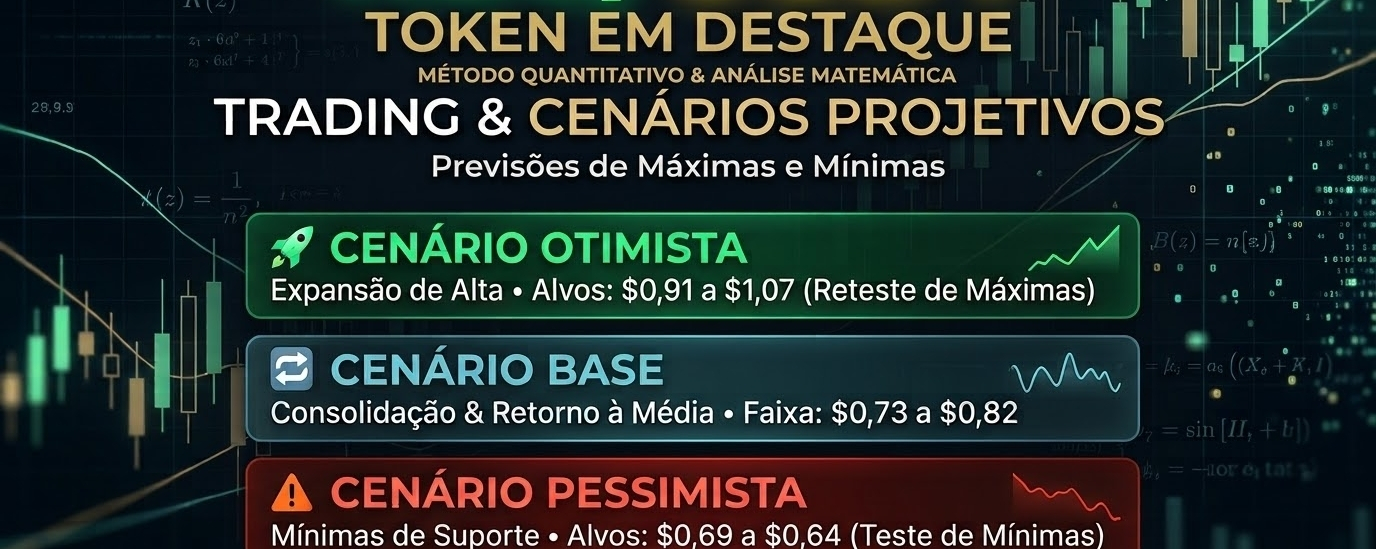

The RLC/USDT chart is not just candlesticks and colors: it is a stochastic probability distribution seeking equilibrium after an extreme volatility peak.
After an impulsive expansion to a high of $1.0770 (+162% from the base), the price suffered a violent rejection due to exhaustion of buying liquidity, returning to the mean-reversion zone around $0.7760 (+18.49% over the last 24h).
1. Technical Indicators & Variables Diagnosis
* Bollinger Structure & Mean Reversion: The price is gravitating exactly around the Bollinger Middle Band (MB) at $0.7797. The squeeze between the lower band ($0.7334) and the upper band ($0.8259) indicates a transition from a high-volatility phase (peak at the top) to a local consolidation/accumulation phase.
* Moving Averages (EMA/MA): EMA(7) at $0.7720 provides immediate intraday support, but the price is stuck below EMA(25) at $0.7956 and the MA(99) pivot at $0.8147, signaling a heavy supply congestion zone.
* Supertrend & SAR: Supertrend remains in sell mode at $0.8284, acting as the first major structural resistance. Parabolic SAR at $0.7512 marks the technical defense line for bulls.
* Momentum (RSI & KDJ): RSI(6) stabilized at 51.86 (perfectly neutral territory). However, KDJ shows a bullish turn, with the J component crossing upward (78.25), while the MACD histogram is attempting its first green bar in positive territory after the local bottom.
2. Scenario Projections & Mathematical Expectancy E(X)
🚀 Bullish Scenario: Continuation Expansion (Estimated Probability: 35%)
* Confirmation Trigger: 1h/4h candle close above the $0.8284 barrier (Supertrend + Upper Bollinger Band).
* Technical Targets:
* $0.9130 (61.8% Fibonacci retracement of the $1.0770 \rightarrow 0.6488 downward move).
* $0.9850 (Pre-peak liquidity level).
* $1.0770 (Retest of the 24h high).
🔄 Base Scenario: Consolidation & Mean Reversion (Estimated Probability: 45%)
* Dynamics: The asset is fluctuating between SAR support ($0.7512) and Supertrend resistance ($0.8284), building a triangular accumulation structure or consolidation rectangle to dissipate excess leverage.
* Trading Range: $0.7330–$0.8280. Ideal for Grid Trading and Mean Reversion strategies.
⚠️ Bearish Scenario: Support Breakdown (Estimated Probability: 20%)
* Confirmation Trigger: Sustained loss of the Bollinger lower band at $0.7334, accompanied by increased selling volume.
* Downside Targets:
* $0.6920 (Intermediate absorption support).
* $0.6488 (24h low / liquidation double bottom).
3. Execution & Risk Management Matrix
To maintain positive mathematical expectancy (E(X) > 0), the risk/reward asymmetry must be strictly respected:
* Tactical Entry: $0.7550–$0.7700 region (near Parabolic SAR support).
* Mandatory Stop-Loss: $0.7290 (Below the lower Bollinger Band and recent structure; risk limited to ~5.5%).
* Scaled Take-Profit: 50% of the position at $0.8280 (R:R ratio of 1:1.2) and the remaining 50% targeting $0.9130 (final R:R ratio of 1:2.7).
> Markets don't move on guesses; they move on order-flow asymmetry and probability. Protect your capital and let statistics work in your favor.
#Binance #AnaliseQuantitativa #BinanceSquare #RLC/USDT #RLC $RLC