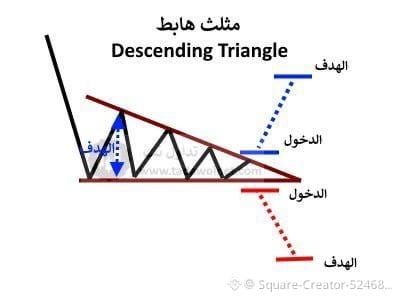
This is called a descending triangle 📉
🔹 It consists of a horizontal support line (below) + a downward-sloping resistance line (above).
🔹 It’s usually considered a bearish continuation pattern, meaning the price is likely to keep falling.
🔹 Entry point: when the price breaks below support 🔻.
🔹 Target: roughly the same distance as the triangle’s height, projected downward 🎯.
🔹 Sometimes, if it breaks upward, it can be a buy entry, but the probability is lower ✅.
📌 In short: it’s a bearish signal, but the most important thing is to wait for the breakout and confirmation.
🔹 It consists of a horizontal support line (below) + a downward-sloping resistance line (above).
🔹 It’s usually considered a bearish continuation pattern, meaning the price is likely to keep falling.
🔹 Entry point: when the price breaks below support 🔻.
🔹 Target: roughly the same distance as the triangle’s height, projected downward 🎯.
🔹 Sometimes, if it breaks upward, it can be a buy entry, but the probability is lower ✅.
📌 In short: it’s a bearish signal, but the most important thing is to wait for the breakout and confirmation.