#BTC走势分析 $BTC
Bitcoin at 85,750: here’s the full picture for bulls and bears
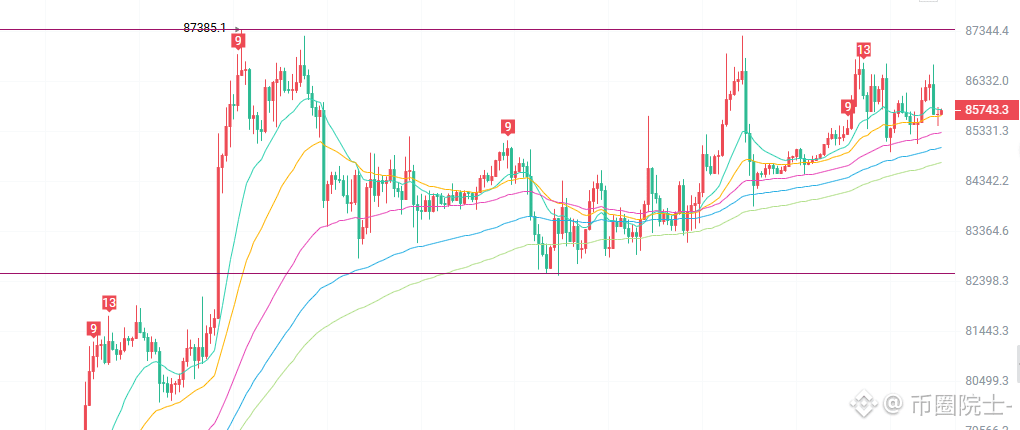
On the 2-hour chart, the bullish structure is solid. Since rising from 80,095, price hasn’t really fallen back, and every pullback has been shallow, showing strong buying support below. The MACD green bars are almost gone, so a reversal could be just around the corner.
On the 15-minute chart, price has made a V-shaped reversal from 84,910, and the MACD is about to form a golden cross. There may be another short-term push upward; first, let’s see if it can hold above 86,000.
Trading plan:
Aggressive traders can try a small long position now, with a stop-loss at 85,400 and a target of 86,200–86,500. Conservative traders can wait for a pullback to 85,500 before entering for a better risk/reward ratio. Don’t rush into a short. If you really want to go short, wait until price reaches the 86,400–86,600 resistance zone.
The market always deals you a blow just when you’re feeling comfortable. Let go of greed and fear, and you’ve already won half the battle.
Bitcoin at 85,750: here’s the full picture for bulls and bears
On the 2-hour chart, the bullish structure is solid. Since rising from 80,095, price hasn’t really fallen back, and every pullback has been shallow, showing strong buying support below. The MACD green bars are almost gone, so a reversal could be just around the corner.
On the 15-minute chart, price has made a V-shaped reversal from 84,910, and the MACD is about to form a golden cross. There may be another short-term push upward; first, let’s see if it can hold above 86,000.
Trading plan:
Aggressive traders can try a small long position now, with a stop-loss at 85,400 and a target of 86,200–86,500. Conservative traders can wait for a pullback to 85,500 before entering for a better risk/reward ratio. Don’t rush into a short. If you really want to go short, wait until price reaches the 86,400–86,600 resistance zone.
The market always deals you a blow just when you’re feeling comfortable. Let go of greed and fear, and you’ve already won half the battle.