❓ Everyone has been wondering lately: What happened to $LSK ? Where is it headed, and what does the future hold for it?
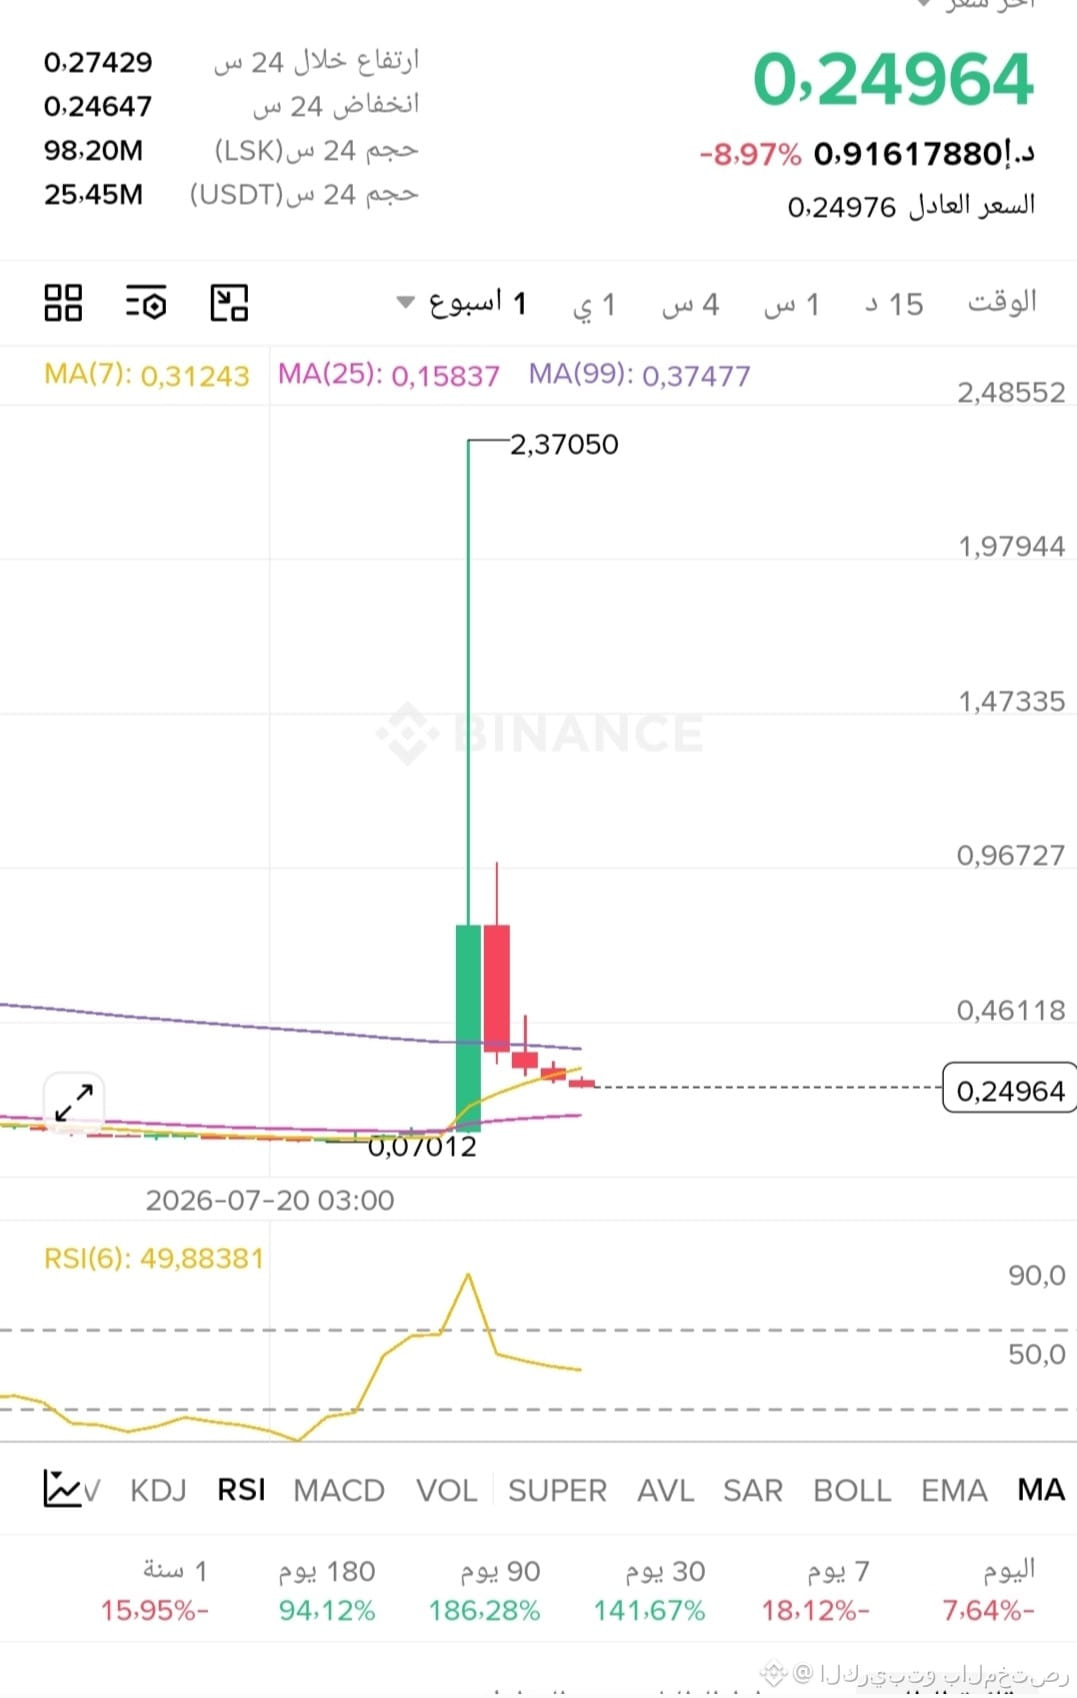
The weekly chart reveals the answer: we can clearly see the terrifying price explosion that started from a deep bottom at $0.07012 and hit a towering peak at $2.37050 [B], followed by a sharp red drop candle as market whales took profits [B].
The price has now settled at $0.24964, and the short-term indicators on the daily chart have changed: the RSI fell below the 30 line, reaching 27.71434. This historic oversold condition reflects sellers running out of steam, so I expect an excellent upward rebound in the coming period that will retest the nearby moving average.
As usual, only use small amounts you can afford to lose, be patient, and don't get greedy.
I'll try this adventure and consider the money as thrown away on the road, so I'll choose a very small amount.
$LSK
The weekly chart reveals the answer: we can clearly see the terrifying price explosion that started from a deep bottom at $0.07012 and hit a towering peak at $2.37050 [B], followed by a sharp red drop candle as market whales took profits [B].
The price has now settled at $0.24964, and the short-term indicators on the daily chart have changed: the RSI fell below the 30 line, reaching 27.71434. This historic oversold condition reflects sellers running out of steam, so I expect an excellent upward rebound in the coming period that will retest the nearby moving average.
As usual, only use small amounts you can afford to lose, be patient, and don't get greedy.
I'll try this adventure and consider the money as thrown away on the road, so I'll choose a very small amount.
$LSK