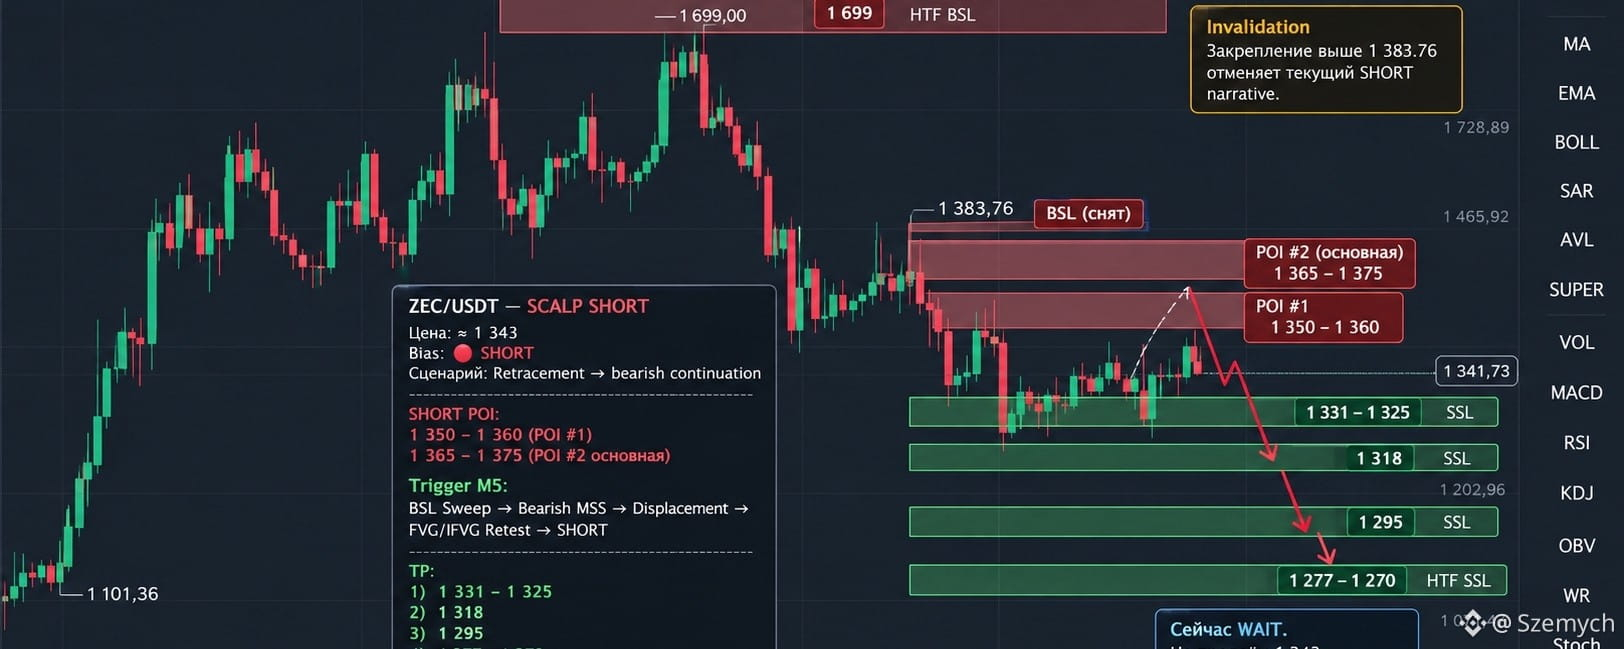

#ZEC ZEC/USDT — full analysis.
Current price based on the charts provided: ≈ 1,343 USDT.
I analyze the structure strictly from D1 → H4 → H1 → M15 → M5, starting with the Narrative and liquidity, and only then looking for an entry. Additionally, the current broader market context confirms ZEC’s high volatility: the asset has risen sharply over the past year and is now correcting after reaching an extreme of around 1,699.
1. D1 — HTF Narrative
Narrative A → B
A: around 250–300 → B: 1 699
ZEC has formed a powerful bullish delivery:
Accumulation → displacement → expansion → 1 699 BSL
After the 1 699 BSL was taken, the market shifted into distribution/correction.
Now, this is an important point:
The HTF bullish expansion hasn't been invalidated yet, but current delivery is downwards.
That is, I don't view the current market as a clean reversal into a full bearish trend. For now, this is a correction after an extreme expansion.
Invalidation C
The key area for the HTF bullish narrative is:
C ≈ 1 130–1 040
As long as this zone isn't lost with acceptance, the long-term bullish narrative remains intact.
2. H4 — structure
On H4, after:
1 699 → 1 270
we got a strong reaction upward:
1 270 → 1 383.76
But 1 383.76 was not accepted above.
After that:
1 383.76 → 1 343
a sequence of lower highs / lower lows is unfolding.
H4 Narrative
1 699 BSL taken → bearish delivery → 1 270 SSL → bullish reaction → 1 383.76 BSL → rejection → bearish delivery
This is a very important sequence.
The market is now trading after the 1 383.76 BSL was taken and bearish delivery began.
3. Key Levels
Level
Value
Role
🔴 Major BSL
1 699
HTF liquidity
🔴 BSL
1 383.76
current key swing high
🔴 Resistance
1 365–1 375
bearish POI
🔴 Resistance
1 350–1 360
nearest retracement
⚖️ Current
1 342–1 344
current price
🟢 SSL
1 331–1 325
first downside liquidity
🟢 SSL
1 318–1 315
next liquidity
🟢 Major SSL
1 295–1 277
HTF demand/liquidity
🟢 Extreme SSL
1 270
H4 swing low
🟢 HTF support
1 130–1 040
D1 structural zone
4. Dealing Range
The cleanest H4 dealing range for the current scalp is:
1 277.16 → 1 383.76
Equilibrium:
≈ 1 330.5
Therefore:
Discount: 1 277 → 1 330
EQ: ≈ 1 330
Premium: 1 330 → 1 384
The current 1 343 is already in the Premium of this dealing range.
This is important:
For a SHORT, price is in the more favorable half of the range.
But I don't want to blindly sell at 1 343, because price has already made a significant bearish delivery and is near the closest SSL.
5. Liquidity Map
Buy-side
1 350–1 360 — local BSL
1 365–1 375 — stronger BSL
1 383.76 — major local BSL
1 413 — previous H1/H4 liquidity reference
1 465 — HTF liquidity
1 599–1 699 — major HTF BSL
Sell-side
1 331–1 325 — nearest SSL
1 318 — next SSL
1 295 — major intraday SSL
1 277.16 / 1 270 — H4 SSL
6. Price Range
For the current intraday move:
1 277 → 1 383.76
But the local working range:
1 318 → 1 383.76
This is where the most interesting liquidity delivery is forming now.
The current price around 1 343 is roughly in the middle of this local structure, so chasing a SHORT now is off the table.
7. POI
🔴 SHORT POI #1
1 350–1 360
This is the first zone where I want to see a retracement.
Especially interesting:
1 354–1 359
if bearish rejection + MSS forms there on M5.
🔴 SHORT POI #2 — primary
1 365–1 375
This is a higher-quality zone.
Why:
Premium dealing range
previous H1 liquidity
upper part of the last bearish delivery
BSL above current price
potential liquidity sweep zone
possible FVG/IFVG confluence
If price gives:
1343 → 1355 → 1365/1370
I'll be much more alert for SHORT setups.
🟢 LONG POI
1 325–1 331
But not a limit LONG.
We need:
SSL Sweep → bullish MSS → Displacement → FVG/IFVG Retest
Deep LONG
1 295–1 318
A much more interesting HTF confluence appears here.
But again:
don't catch a falling knife.
8. SNR
Resistance
1 350–1 360
1 365–1 375
1 383.76
Support
1 331–1 325
1 318
1 295
1 277–1 270
The main SNR flip now:
1 350–1 360
If price returns there and gets rejected, the zone could become resistance for continued bearish delivery.
If, however, price accepts above 1 360, the short thesis weakens.
9. FVG / IFVG
A series of inefficiencies formed after the strong bearish delivery down from the 1 380+ area.
The most interesting area for a scalp is approximately:
1 350–1 360
and deeper:
1 365–1 375
Here I prefer to look for an FVG/IFVG retest rather than enter at market.
Logic:
Displacement → imbalance → retracement → FVG/IFVG mitigation → continuation.
10. RB / MB
RB
The last bullish reaction before the reversal from 1 383.76 is forming an area that the market could now retest from below.
Working RB:
≈ 1 355–1 370
MB
Deeper mitigation area:
≈ 1 365–1 375
Therefore, this area is the most interesting SHORT POI #2 for me.
11. FTA / TA
For SHORT:
FTA #1
1 331–1 325
This is the first reason to partially close the position.
FTA #2
1 318
TA
1 295–1 277
Extreme TA
1 270
That is, the expected delivery:
1355–1370 → 1331 → 1318 → 1295 → 1277/1270
12. M5 — Trigger / VC
This is where a real entry appears.
The current price is ≈ 1 343.
And I wouldn't open a SHORT right now.
Why?
Because after:
1 383.76 → 1 343
a significant part of the bearish delivery has already occurred.
Selling here means:
chase price in the direction of a move that has already happened.
For a SHORT, wait for:
Retracement → BSL sweep → bearish MSS → Displacement → FVG/IFVG Retest → Entry
🔴 MAIN SCENARIO — SCALP SHORT
POI
1 350–1 360
The main working zone.
Deeper POI
1 365–1 375
Trigger
On M5:
Price returns to the POI.
Takes local BSL.
A bearish MSS is forming.
Bearish displacement appears.
An FVG/IFVG is forming.
Retest FVG/IFVG.
SHORT Entry.
Entry
Approximately:
1 353–1 360 after confirmation.
For a deep retracement:
1 366–1 372 after confirmation.
Don't enter just because price has reached the zone.
🔴 SHORT SL
For the first POI:
≈ 1 372–1 378
For a deeper POI:
≈ 1 385–1 392
Ideally, though, place the SL beyond the actual sweep / invalidation, rather than mechanically using a fixed number of points.
🎯 SHORT TP
TP1
1 331–1 325
TP2
1 318
TP3
1 295
TP4
1 277–1 270
After TP1, it's advisable to move the remaining position to BE / a protected mode.
🟢 ALTERNATIVE SCENARIO — LONG
The most important thing here is not to try to buy at 1 343 just because price has already fallen.
Wait for delivery into the SSL.
LONG POI #1
1 325–1 331
If the market:
Sweep SSL → bullish MSS → displacement → FVG/IFVG retest
then a LONG setup appears.
Entry
Approximately:
1 326–1 333
only after M5 confirmation.
SL
below the sweep low, approximately under 1 318.
TP
TP1: 1 343
TP2: 1 355–1 360
TP3: 1 365–1 375
TP4: 1 383.76
🟢 DEEP LONG
If 1 325 doesn't hold, I won't automatically flip to SHORT.
Next zone:
1 295–1 318
Here, we wait again for:
SSL Sweep → MSS → Displacement → FVG/IFVG Retest
And only after that, LONG.
Targets:
1 325 → 1 343 → 1 360 → 1 375
⚠️ Invalidation C
For the main SHORT scenario:
M5/H1 acceptance above 1 383.76
will be a serious warning.
Especially if we get:
1 383.76 breakout → retest from above → bullish continuation.
Then the bearish intraday narrative:
BSL sweep → bearish delivery
becomes invalid.
Next upside delivery:
1 413 → 1 450–1 465
🧠 Final model.
D1
1699 BSL
↓
Bearish correction
↓
H4
1270 SSL
↓
Bullish reaction
↓
1383.76 BSL
↓
REJECTION
↓
Bearish delivery
↓
H1
1350–1375 RETRACEMENT POI
↓
M15
BSL sweep
↓
M5
Bearish MSS
↓
Displacement
↓
FVG / IFVG Retest
↓
SHORT
↓
1331
↓
1318
↓
1295
↓
1277–1270
🔥 My priority right now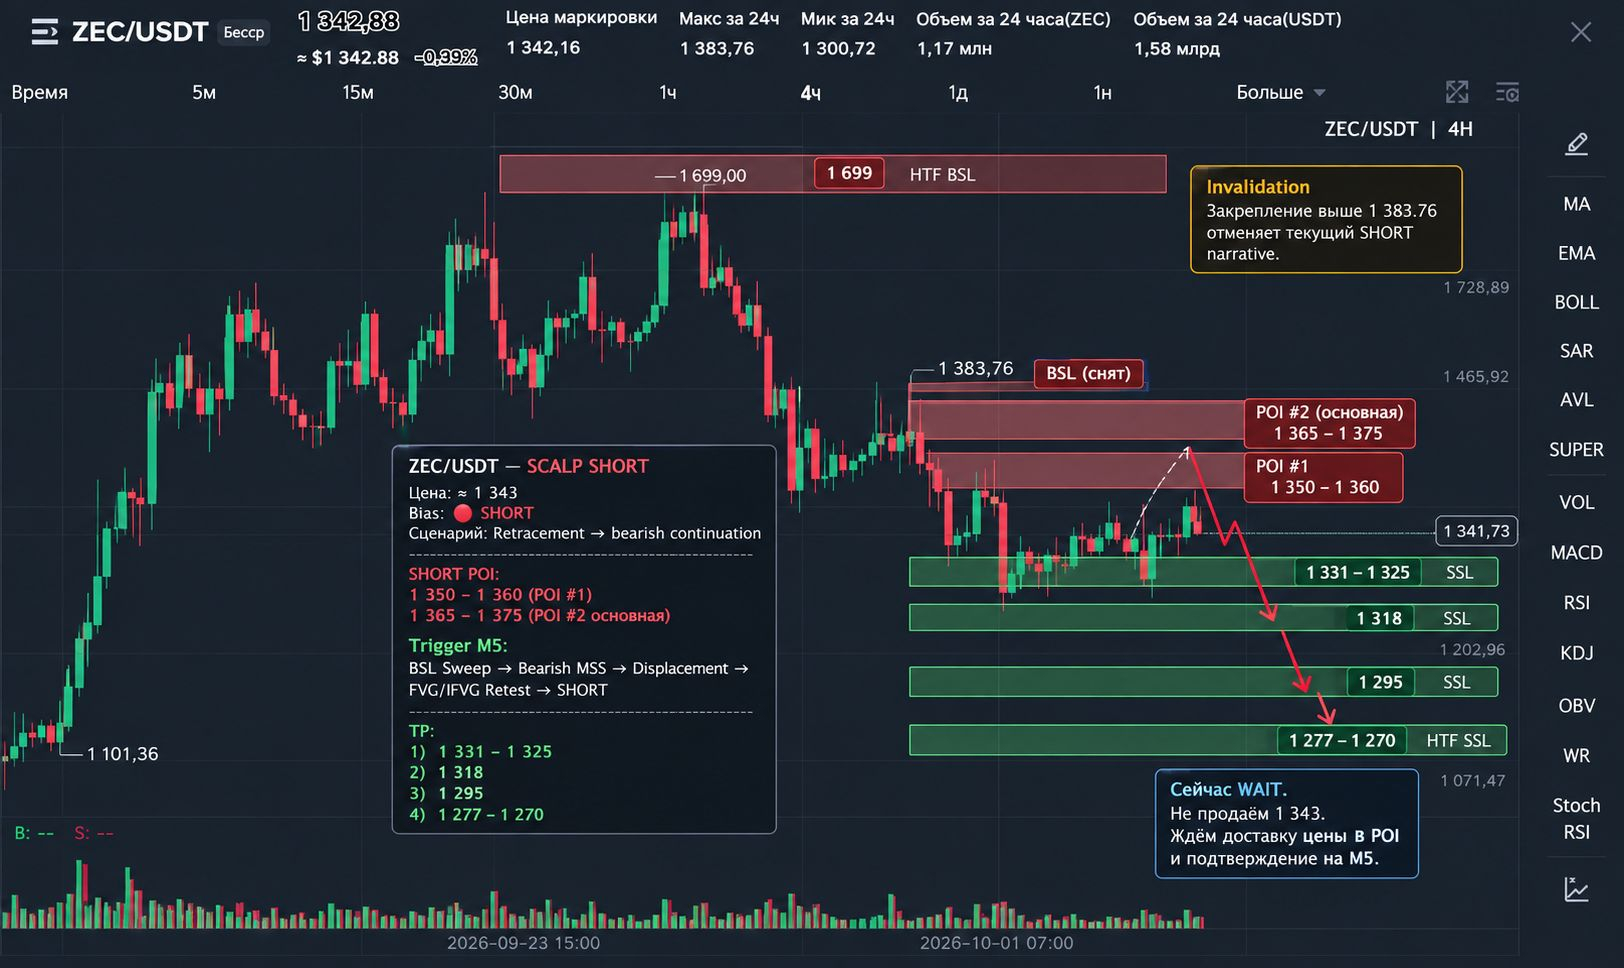
Bias: 🔴 SHORT / bearish retracement continuation
But the key rule:
No SHORT at 1 343.
Price has already moved down after the 1 383.76 BSL sweep, so now we're waiting for a return to Premium/POI, followed by confirmation on M5.
Working plan
SHORT #1: 1 350–1 360
SHORT #2: 1 365–1 375
Trigger: BSL Sweep → MSS → Displacement → FVG/IFVG Retest
TP: 1 331 → 1 318 → 1 295 → 1 277/1270
Alternative
LONG: 1 325–1 331 only after an SSL Sweep + bullish MSS.
Deep LONG: 1 295–1 318 after confirmation.
At the current 1 342–1 344, WAIT rather than chase.
Recent market data also shows that ZEC remains an exceptionally volatile asset; the current correction is taking place after an extreme September rally, so structural confirmation is especially important here. $ZEC