SOL/USDT — Technical Analysis (4h Chart)
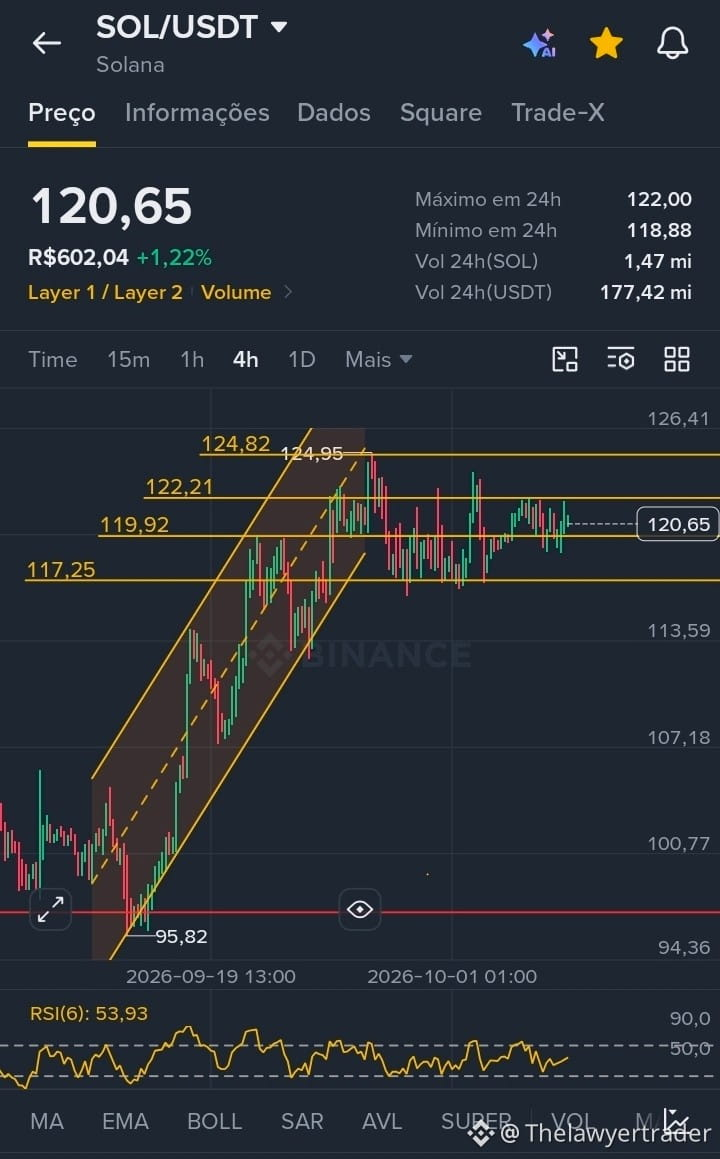
Solana is trading at 120.65 USDT, consolidating after breaking below an ascending channel. The price is now moving sideways within a well-defined range, indicating indecision between buyers and sellers.
Support and resistance:
Main support: 117.25 USDT — a critical level; losing this level could open the door to a deeper decline.
Main resistance: 124.82 USDT — a break above this level would signal a resumption of the uptrend.
Intermediate levels: 119.92 USDT (immediate support/resistance) and 122.21 USDT (short-term resistance).
Verifiable chart pattern:
An ascending channel has been broken to the downside on the 4h chart, followed by sideways consolidation. The RSI(6) is at 53.93, in neutral territory, with no overbought or oversold conditions, reinforcing the outlook of indecision. Sideways movement is more likely to continue while the price remains between 117.25 and 124.82; the direction will only become clear once one of these boundaries is broken.
Please note: This analysis is for informational purposes only, is based on chart analysis, and does not constitute investment advice. Cryptocurrency markets are volatile; do your own research before making any decisions.
$SOL #SolanaStrong
Solana is trading at 120.65 USDT, consolidating after breaking below an ascending channel. The price is now moving sideways within a well-defined range, indicating indecision between buyers and sellers.
Support and resistance:
Main support: 117.25 USDT — a critical level; losing this level could open the door to a deeper decline.
Main resistance: 124.82 USDT — a break above this level would signal a resumption of the uptrend.
Intermediate levels: 119.92 USDT (immediate support/resistance) and 122.21 USDT (short-term resistance).
Verifiable chart pattern:
An ascending channel has been broken to the downside on the 4h chart, followed by sideways consolidation. The RSI(6) is at 53.93, in neutral territory, with no overbought or oversold conditions, reinforcing the outlook of indecision. Sideways movement is more likely to continue while the price remains between 117.25 and 124.82; the direction will only become clear once one of these boundaries is broken.
Please note: This analysis is for informational purposes only, is based on chart analysis, and does not constitute investment advice. Cryptocurrency markets are volatile; do your own research before making any decisions.
$SOL #SolanaStrong