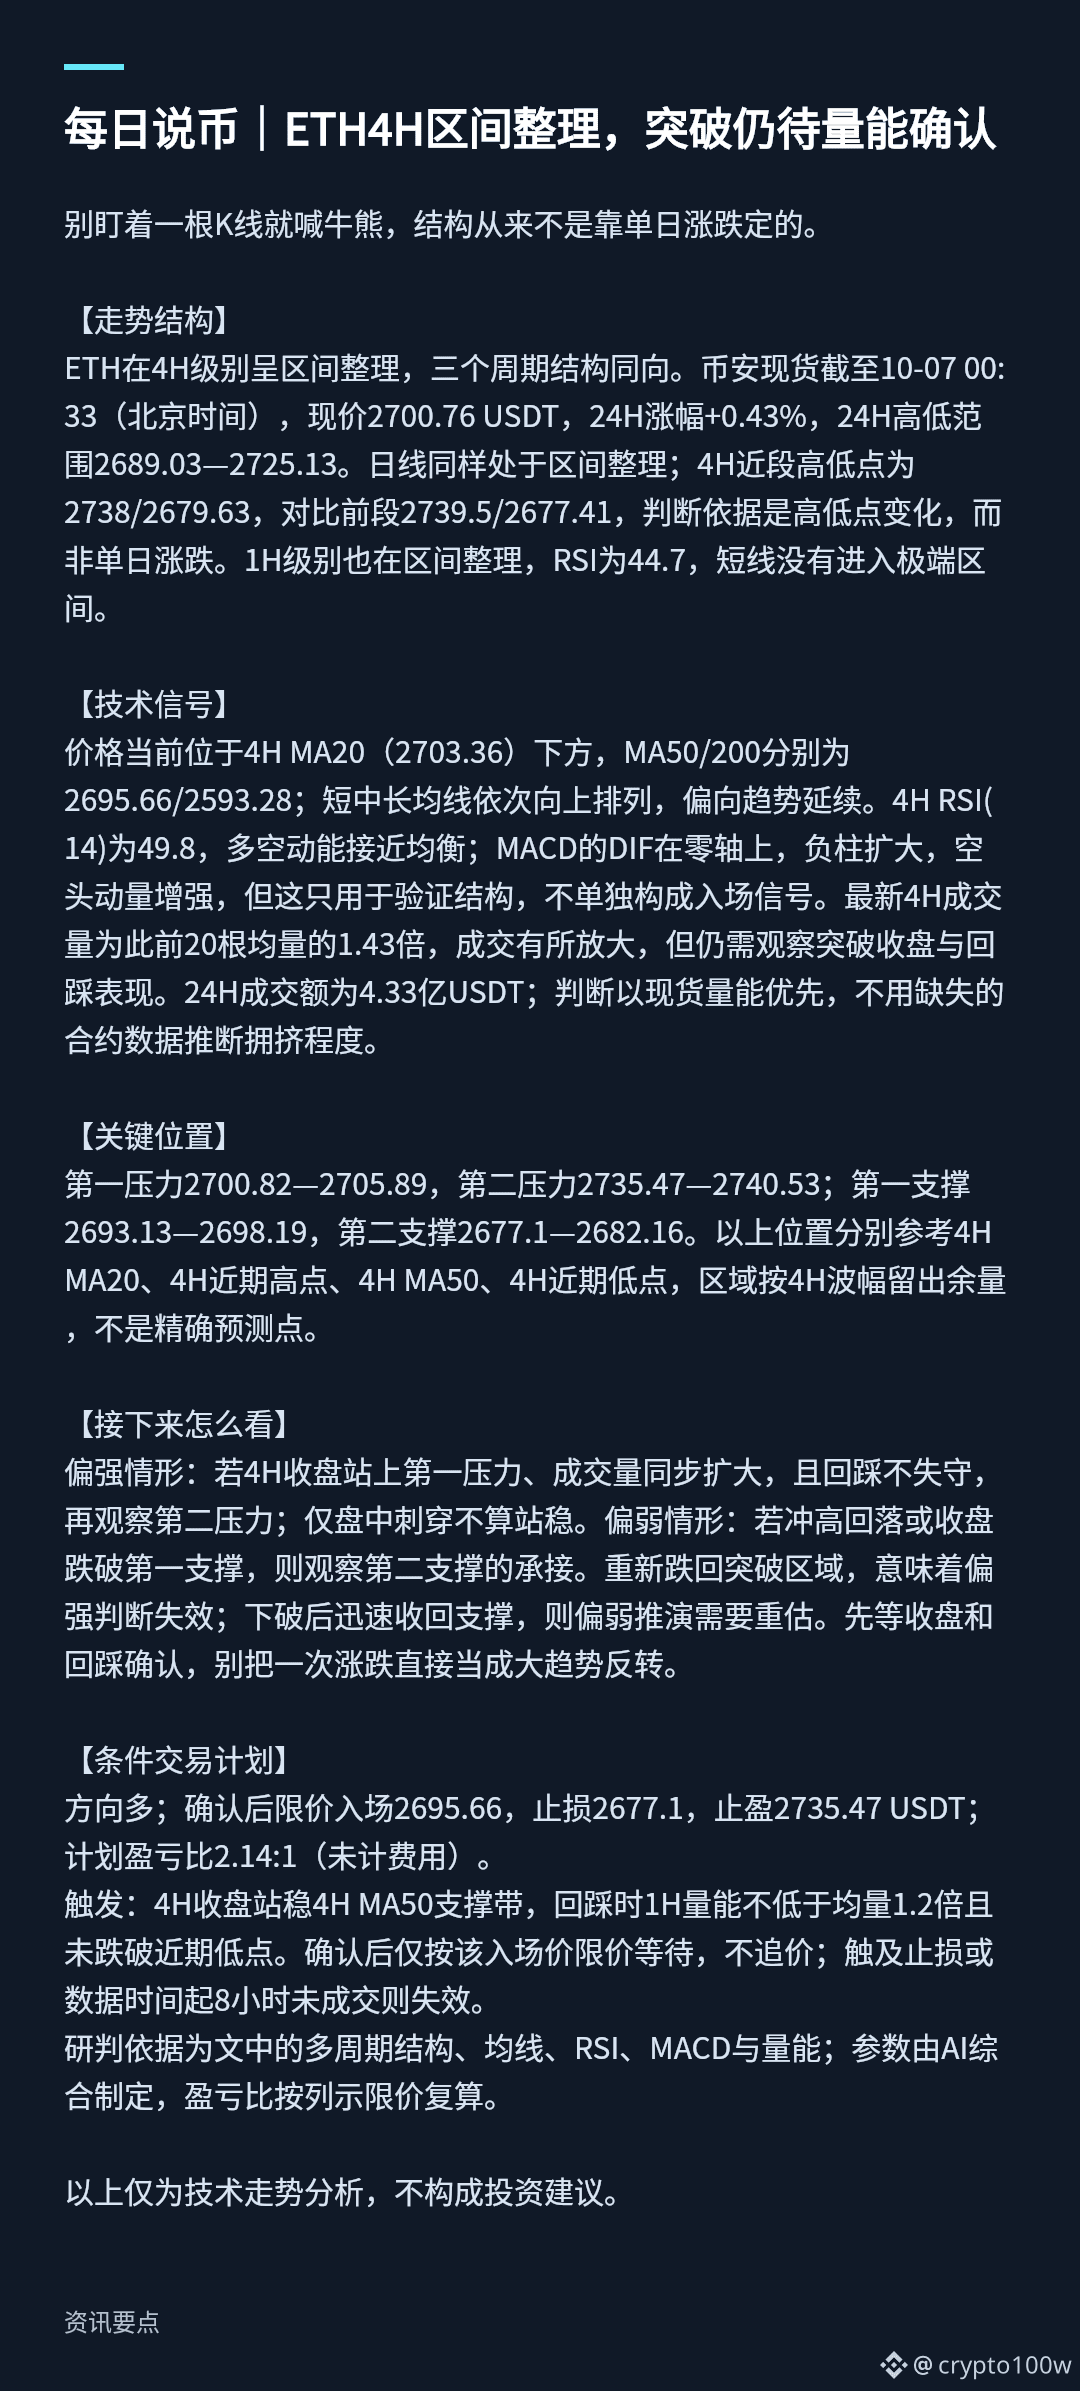
Don’t call it a bull or bear market based on a single candlestick. Market structure is never determined by a one-day rise or fall.
【Market Structure】
ETH is consolidating within a range on the 4H timeframe, with all three timeframe structures aligned. Binance spot data as of 10-07 00:33 (Beijing time): current price 2700.76 USDT, 24H change +0.43%, and 24H range 2689.03–2725.13. The daily chart is also consolidating within a range. Recent 4H highs and lows are 2738/2679.63, compared with 2739.5/2677.41 in the preceding period. This assessment is based on changes in highs and lows, not on one-day price moves. The 1H timeframe is also range-bound, with an RSI of 44.7; short-term conditions are not in an extreme zone.
【Technical Signals】
Price is currently below the 4H MA20 (2703.36); the MA50/200 are 2695.66/2593.28, respectively. The short-, medium-, and long-term moving averages are aligned upward, favoring trend continuation. The 4H RSI(14) is 49.8, indicating a near balance between bullish and bearish momentum. The MACD DIF is above the zero line, while the negative histogram bars are expanding, signaling strengthening bearish momentum. However, this is only used to validate the structure and does not constitute an entry signal on its own. The latest 4H volume is 1.43 times the average volume of the previous 20 candles, showing an increase in activity, but a breakout close and the subsequent retest still need to be observed. 24H trading volume is 433 million USDT. Spot volume is prioritized in this assessment; missing futures data is not used to infer market crowding.
【Key Levels】
First resistance: 2700.82–2705.89; second resistance: 2735.47–2740.53. First support: 2693.13–2698.19; second support: 2677.1–2682.16. These levels are based respectively on the 4H MA20, recent 4H high, 4H MA50, and recent 4H low. The zones allow for the 4H price range and are not precise price predictions.
【What to Watch Next】
Bullish scenario: If a 4H candle closes above the first resistance with volume increasing at the same time, and the level holds on a retest, then watch the second resistance. An intraday spike above the level alone does not count as holding above it. Bearish scenario: If price rallies and then pulls back, or closes below the first support, watch for buying interest at the second support. A move back below the breakout zone would invalidate the bullish view; if price quickly reclaims support after breaking below it, the bearish outlook should be reassessed. Wait for confirmation from the close and retest; don’t mistake a single price move for a major trend reversal.
【Conditional Trading Plan】
Direction: Long. Entry after confirmation: limit order at 2695.66; stop-loss: 2677.1; take-profit: 2735.47 USDT. Planned risk/reward ratio: 2.14:1 (excluding fees).
Trigger: A 4H candle closes and holds above the 4H MA50 support zone; on the retest, 1H volume is at least 1.2 times average volume and price does not break below the recent low. After confirmation, wait with a limit order at the specified entry price only; do not chase the price. The setup is invalidated if the stop-loss is hit or if the order has not filled within 8 hours of the data timestamp.
The analysis is based on the multi-timeframe structure, moving averages, RSI, MACD, and volume discussed above. Parameters were determined by AI, and the risk/reward ratio was recalculated using the listed limit prices.
This is technical market analysis only and does not constitute investment advice.
【Market Structure】
ETH is consolidating within a range on the 4H timeframe, with all three timeframe structures aligned. Binance spot data as of 10-07 00:33 (Beijing time): current price 2700.76 USDT, 24H change +0.43%, and 24H range 2689.03–2725.13. The daily chart is also consolidating within a range. Recent 4H highs and lows are 2738/2679.63, compared with 2739.5/2677.41 in the preceding period. This assessment is based on changes in highs and lows, not on one-day price moves. The 1H timeframe is also range-bound, with an RSI of 44.7; short-term conditions are not in an extreme zone.
【Technical Signals】
Price is currently below the 4H MA20 (2703.36); the MA50/200 are 2695.66/2593.28, respectively. The short-, medium-, and long-term moving averages are aligned upward, favoring trend continuation. The 4H RSI(14) is 49.8, indicating a near balance between bullish and bearish momentum. The MACD DIF is above the zero line, while the negative histogram bars are expanding, signaling strengthening bearish momentum. However, this is only used to validate the structure and does not constitute an entry signal on its own. The latest 4H volume is 1.43 times the average volume of the previous 20 candles, showing an increase in activity, but a breakout close and the subsequent retest still need to be observed. 24H trading volume is 433 million USDT. Spot volume is prioritized in this assessment; missing futures data is not used to infer market crowding.
【Key Levels】
First resistance: 2700.82–2705.89; second resistance: 2735.47–2740.53. First support: 2693.13–2698.19; second support: 2677.1–2682.16. These levels are based respectively on the 4H MA20, recent 4H high, 4H MA50, and recent 4H low. The zones allow for the 4H price range and are not precise price predictions.
【What to Watch Next】
Bullish scenario: If a 4H candle closes above the first resistance with volume increasing at the same time, and the level holds on a retest, then watch the second resistance. An intraday spike above the level alone does not count as holding above it. Bearish scenario: If price rallies and then pulls back, or closes below the first support, watch for buying interest at the second support. A move back below the breakout zone would invalidate the bullish view; if price quickly reclaims support after breaking below it, the bearish outlook should be reassessed. Wait for confirmation from the close and retest; don’t mistake a single price move for a major trend reversal.
【Conditional Trading Plan】
Direction: Long. Entry after confirmation: limit order at 2695.66; stop-loss: 2677.1; take-profit: 2735.47 USDT. Planned risk/reward ratio: 2.14:1 (excluding fees).
Trigger: A 4H candle closes and holds above the 4H MA50 support zone; on the retest, 1H volume is at least 1.2 times average volume and price does not break below the recent low. After confirmation, wait with a limit order at the specified entry price only; do not chase the price. The setup is invalidated if the stop-loss is hit or if the order has not filled within 8 hours of the data timestamp.
The analysis is based on the multi-timeframe structure, moving averages, RSI, MACD, and volume discussed above. Parameters were determined by AI, and the risk/reward ratio was recalculated using the listed limit prices.
This is technical market analysis only and does not constitute investment advice.