【NEAR in a nutshell: Hot news and technicals converge—bearish or a false breakout?】
【Hot News】
When news and price action converge, it’s worth reviewing the data and headlines together.
“Near Protocol (NEAR) Builds Triple Top: This Is Why $5 Is Under Pressure” — U.Today reports that Near’s rally is certainly exhausted, as multiple local resistance levels have proven unbreakable.
The biggest risk with event-driven price action is sentiment becoming overstretched, so whether key levels hold matters more than the news itself.
【Market Snapshot】
$NEAR is currently at 5.114, up 2.28% over 24 hours, with 24-hour trading volume of approximately 131.7M USDT.
【Technical Analysis】
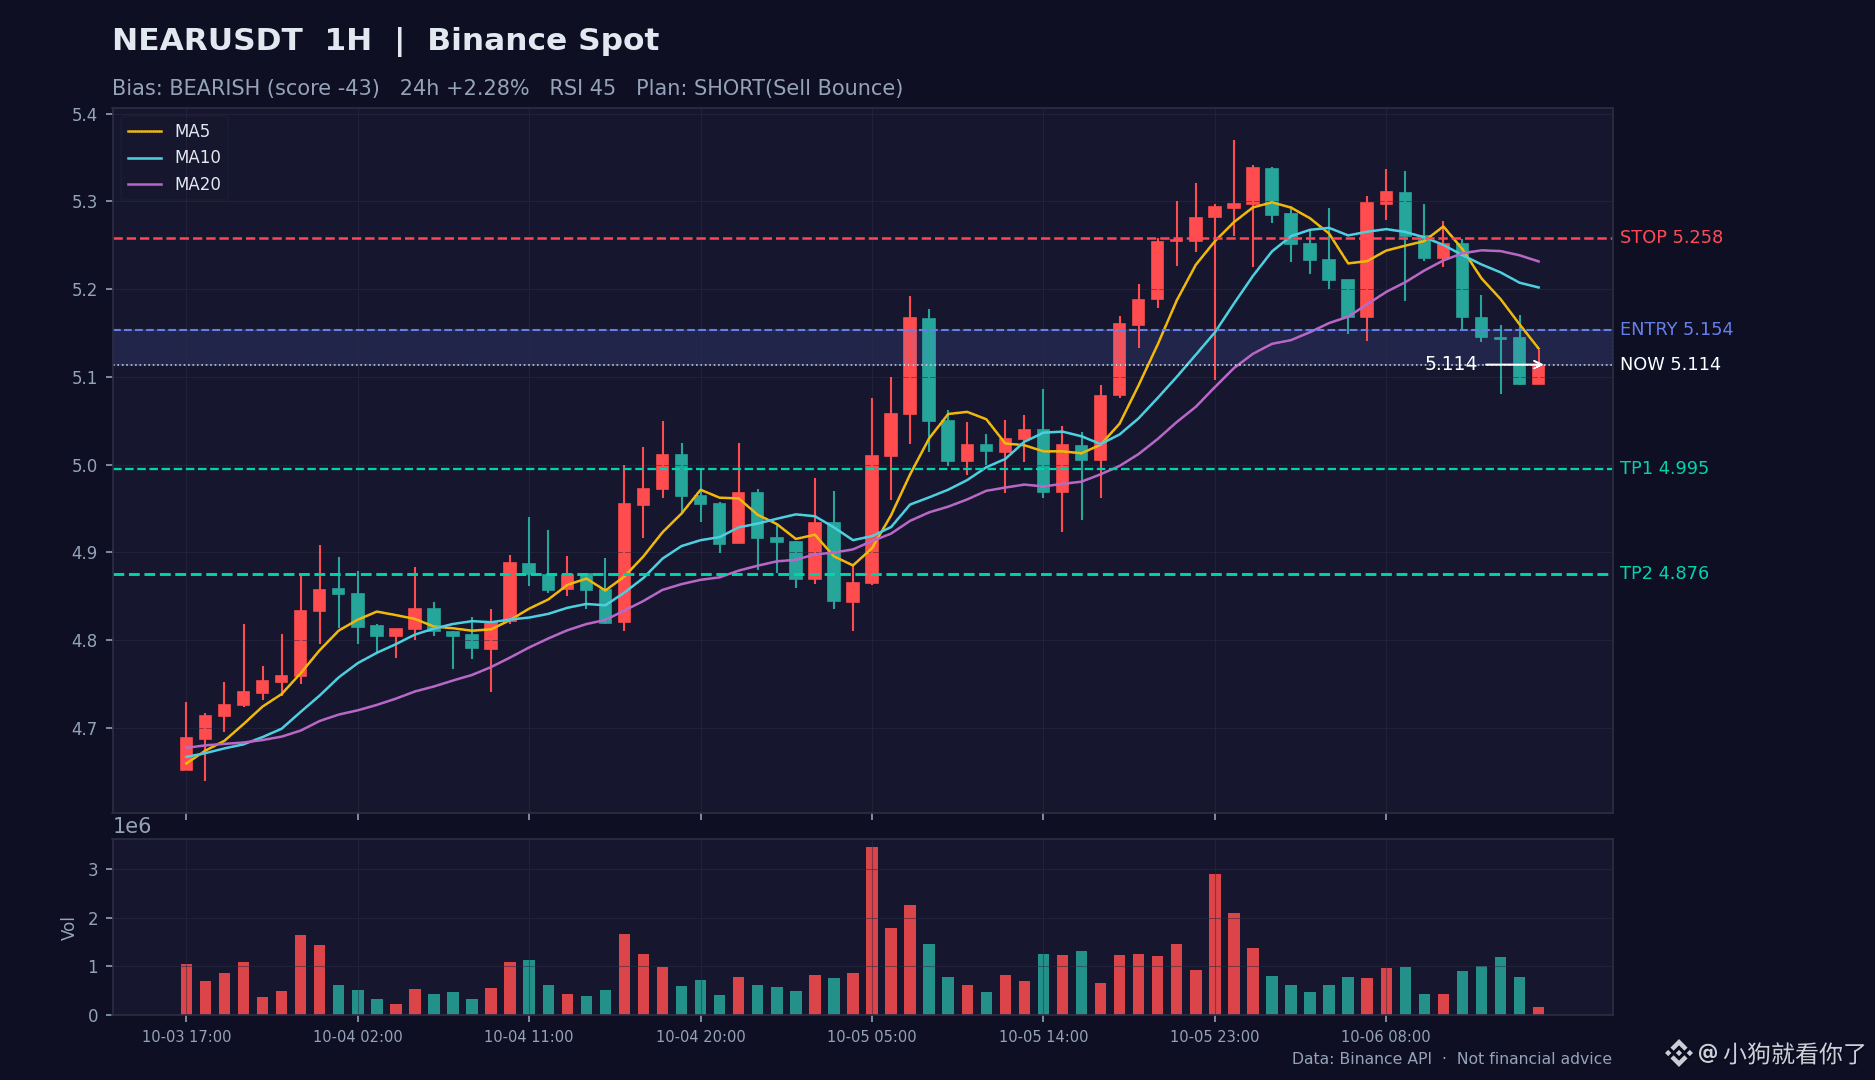
· Moving averages: Short-term moving averages have crossed bearishly, and the price has fallen below MA20, showing clear short-term weakness.
· Momentum: The MACD fast line is below the zero line, and the histogram remains negative, suggesting bearish momentum may not have run its course. RSI (45) is weak; any rebound needs confirmation from higher volume.
· Pattern: The price is hugging the lower Bollinger Band, while conditions for an oversold bounce are building. Volume has contracted to 0.2 times its average, so directional signals should be treated cautiously in this low-volume environment.
【Directional Outlook】
Overall score: -43/100. The structure is bearish: moving-average resistance and weakening momentum. A short entry near the upper end of the entry zone on a rebound offers a better defensive setup, with the first target below. A high-volume recovery above the stop-loss level would invalidate the bearish thesis.
【Sample Trading Plan】
· Strategy: Short the rebound
· Entry zone: 5.114 ~ 5.154
· Take profit: First target 4.995; second target 4.876
· Stop loss: 5.258
· Position size: Small, 5%–10%; strictly exit if the stop-loss level is breached.
· Chart: The candlestick analysis chart is included with the post (1-hour chart; red for rising candles and green for falling candles; entry zone, take-profit, and stop-loss levels are marked with colored lines).
【Risk Warning】Smaller-cap coins are highly volatile, and event-driven price moves can reverse quickly. Keep position sizes under control.
This is for personal review and technical analysis purposes only and does not constitute investment advice. DYOR.
$NEAR #NEAR #加密货币 #MarketAnalysis
【Hot News】
When news and price action converge, it’s worth reviewing the data and headlines together.
“Near Protocol (NEAR) Builds Triple Top: This Is Why $5 Is Under Pressure” — U.Today reports that Near’s rally is certainly exhausted, as multiple local resistance levels have proven unbreakable.
The biggest risk with event-driven price action is sentiment becoming overstretched, so whether key levels hold matters more than the news itself.
【Market Snapshot】
$NEAR is currently at 5.114, up 2.28% over 24 hours, with 24-hour trading volume of approximately 131.7M USDT.
【Technical Analysis】
· Moving averages: Short-term moving averages have crossed bearishly, and the price has fallen below MA20, showing clear short-term weakness.
· Momentum: The MACD fast line is below the zero line, and the histogram remains negative, suggesting bearish momentum may not have run its course. RSI (45) is weak; any rebound needs confirmation from higher volume.
· Pattern: The price is hugging the lower Bollinger Band, while conditions for an oversold bounce are building. Volume has contracted to 0.2 times its average, so directional signals should be treated cautiously in this low-volume environment.
【Directional Outlook】
Overall score: -43/100. The structure is bearish: moving-average resistance and weakening momentum. A short entry near the upper end of the entry zone on a rebound offers a better defensive setup, with the first target below. A high-volume recovery above the stop-loss level would invalidate the bearish thesis.
【Sample Trading Plan】
· Strategy: Short the rebound
· Entry zone: 5.114 ~ 5.154
· Take profit: First target 4.995; second target 4.876
· Stop loss: 5.258
· Position size: Small, 5%–10%; strictly exit if the stop-loss level is breached.
· Chart: The candlestick analysis chart is included with the post (1-hour chart; red for rising candles and green for falling candles; entry zone, take-profit, and stop-loss levels are marked with colored lines).
【Risk Warning】Smaller-cap coins are highly volatile, and event-driven price moves can reverse quickly. Keep position sizes under control.
This is for personal review and technical analysis purposes only and does not constitute investment advice. DYOR.
$NEAR #NEAR #加密货币 #MarketAnalysis