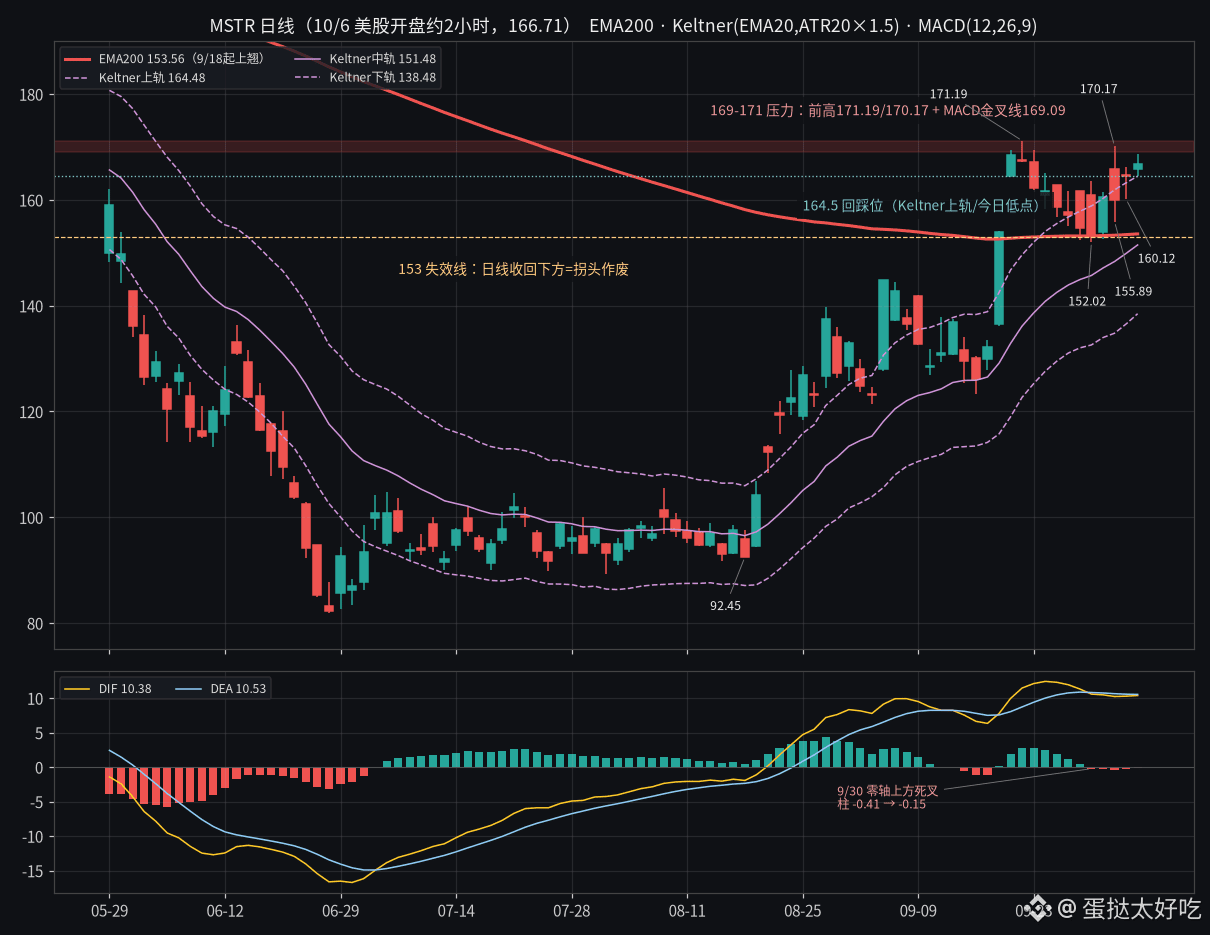
$MSTR has risen 80% in two months. What matters most to me, though, isn’t the size of the gain—it’s that the daily EMA200, which had held it down for an entire year, has finally started to turn upward.
This EMA200 had been trending down almost every day since October 7, 2025, and hadn’t turned up once by September 17 of this year. After climbing above it on September 18 on volume of 54.67 million shares, it began to curl upward. On September 30, the price pulled back to a low of 152.02 and closed at 153.09, just 9 cents below the EMA200, then reclaimed it the very next day. The EMA200 is now at 153.56, with its daily rise accelerating from 0.067 to 0.132.
Now look at its relationship with Bitcoin. Since August 18, MSTR has risen 80%, from 92.52 to 166.71; IBIT has risen 33%, from 36.60 to 48.72. The MSTR/IBIT ratio has climbed from 2.53 to 3.42, close to its September 21 level of 3.44. But a year ago it was 5.05, so the premium is still a long way from where it was back then.
Keltner (EMA20, ATR20×1.5): midline 151.48, upper band 164.48, lower band 138.48. The current price is above the upper band. Over the past 60 trading days, it has closed outside the upper band on 21 days. That’s a trend pattern hugging the upper band; looking at it as simply overbought would be misleading.
MACD (12,26,9): DIF 10.38, DEA 10.53, histogram -0.15. There was a bearish crossover above the zero line on September 30, and since then the histogram has steadily narrowed from -0.41 to -0.15. Working backward, I estimate that a close at 169.09 today would produce a bullish crossover.
Structurally, the highs are stepping down: 171.19, 170.17, and 168.73 today. The lows are rising: 152.02, 155.89, 160.12, and 164.54. The 169–171 area lines up with the previous highs and the crossover level, so that’s where resistance sits. ATR14 is 8.76, or about 5.3%—the price can cover that range in a single day. A little over two hours after the open, volume was 8.46 million shares versus a 20-day average of 22.32 million; volume hasn’t picked up yet.
I’m leaning bullish, but I wouldn’t chase it at 167. A pullback toward 164.5 (the Keltner upper band and today’s low) would be a more comfortable entry. True confirmation would be a daily close above 171.19. If it closes back below 153, then this turn is a false signal, and I’ll have been wrong.
#美股 #MSTR #TechnicalAnalysis
This EMA200 had been trending down almost every day since October 7, 2025, and hadn’t turned up once by September 17 of this year. After climbing above it on September 18 on volume of 54.67 million shares, it began to curl upward. On September 30, the price pulled back to a low of 152.02 and closed at 153.09, just 9 cents below the EMA200, then reclaimed it the very next day. The EMA200 is now at 153.56, with its daily rise accelerating from 0.067 to 0.132.
Now look at its relationship with Bitcoin. Since August 18, MSTR has risen 80%, from 92.52 to 166.71; IBIT has risen 33%, from 36.60 to 48.72. The MSTR/IBIT ratio has climbed from 2.53 to 3.42, close to its September 21 level of 3.44. But a year ago it was 5.05, so the premium is still a long way from where it was back then.
Keltner (EMA20, ATR20×1.5): midline 151.48, upper band 164.48, lower band 138.48. The current price is above the upper band. Over the past 60 trading days, it has closed outside the upper band on 21 days. That’s a trend pattern hugging the upper band; looking at it as simply overbought would be misleading.
MACD (12,26,9): DIF 10.38, DEA 10.53, histogram -0.15. There was a bearish crossover above the zero line on September 30, and since then the histogram has steadily narrowed from -0.41 to -0.15. Working backward, I estimate that a close at 169.09 today would produce a bullish crossover.
Structurally, the highs are stepping down: 171.19, 170.17, and 168.73 today. The lows are rising: 152.02, 155.89, 160.12, and 164.54. The 169–171 area lines up with the previous highs and the crossover level, so that’s where resistance sits. ATR14 is 8.76, or about 5.3%—the price can cover that range in a single day. A little over two hours after the open, volume was 8.46 million shares versus a 20-day average of 22.32 million; volume hasn’t picked up yet.
I’m leaning bullish, but I wouldn’t chase it at 167. A pullback toward 164.5 (the Keltner upper band and today’s low) would be a more comfortable entry. True confirmation would be a daily close above 171.19. If it closes back below 153, then this turn is a false signal, and I’ll have been wrong.
#美股 #MSTR #TechnicalAnalysis