【 Don't just watch the candlesticks! The bullish case for this $XRP move starts with this news】
【Trending Event】
When a trending event and market action converge, it’s worth reviewing the data and news together.
“Circle, Ripple and Standard Chartered invest in OKX at $25 billion valuation” — Crypto.News reports that OKX has completed a strategic investment from Circle, Qube Research & Technologies, Ripple and Standard Charte…
The biggest risk with event-driven price action is overextended sentiment, so whether key levels hold matters more than the news itself.
【Market Snapshot】
$XRP is currently at 1.521, up 1.33% over 24 hours, with 24-hour trading volume of approximately 119.7M USDT.
【Technical Breakdown】
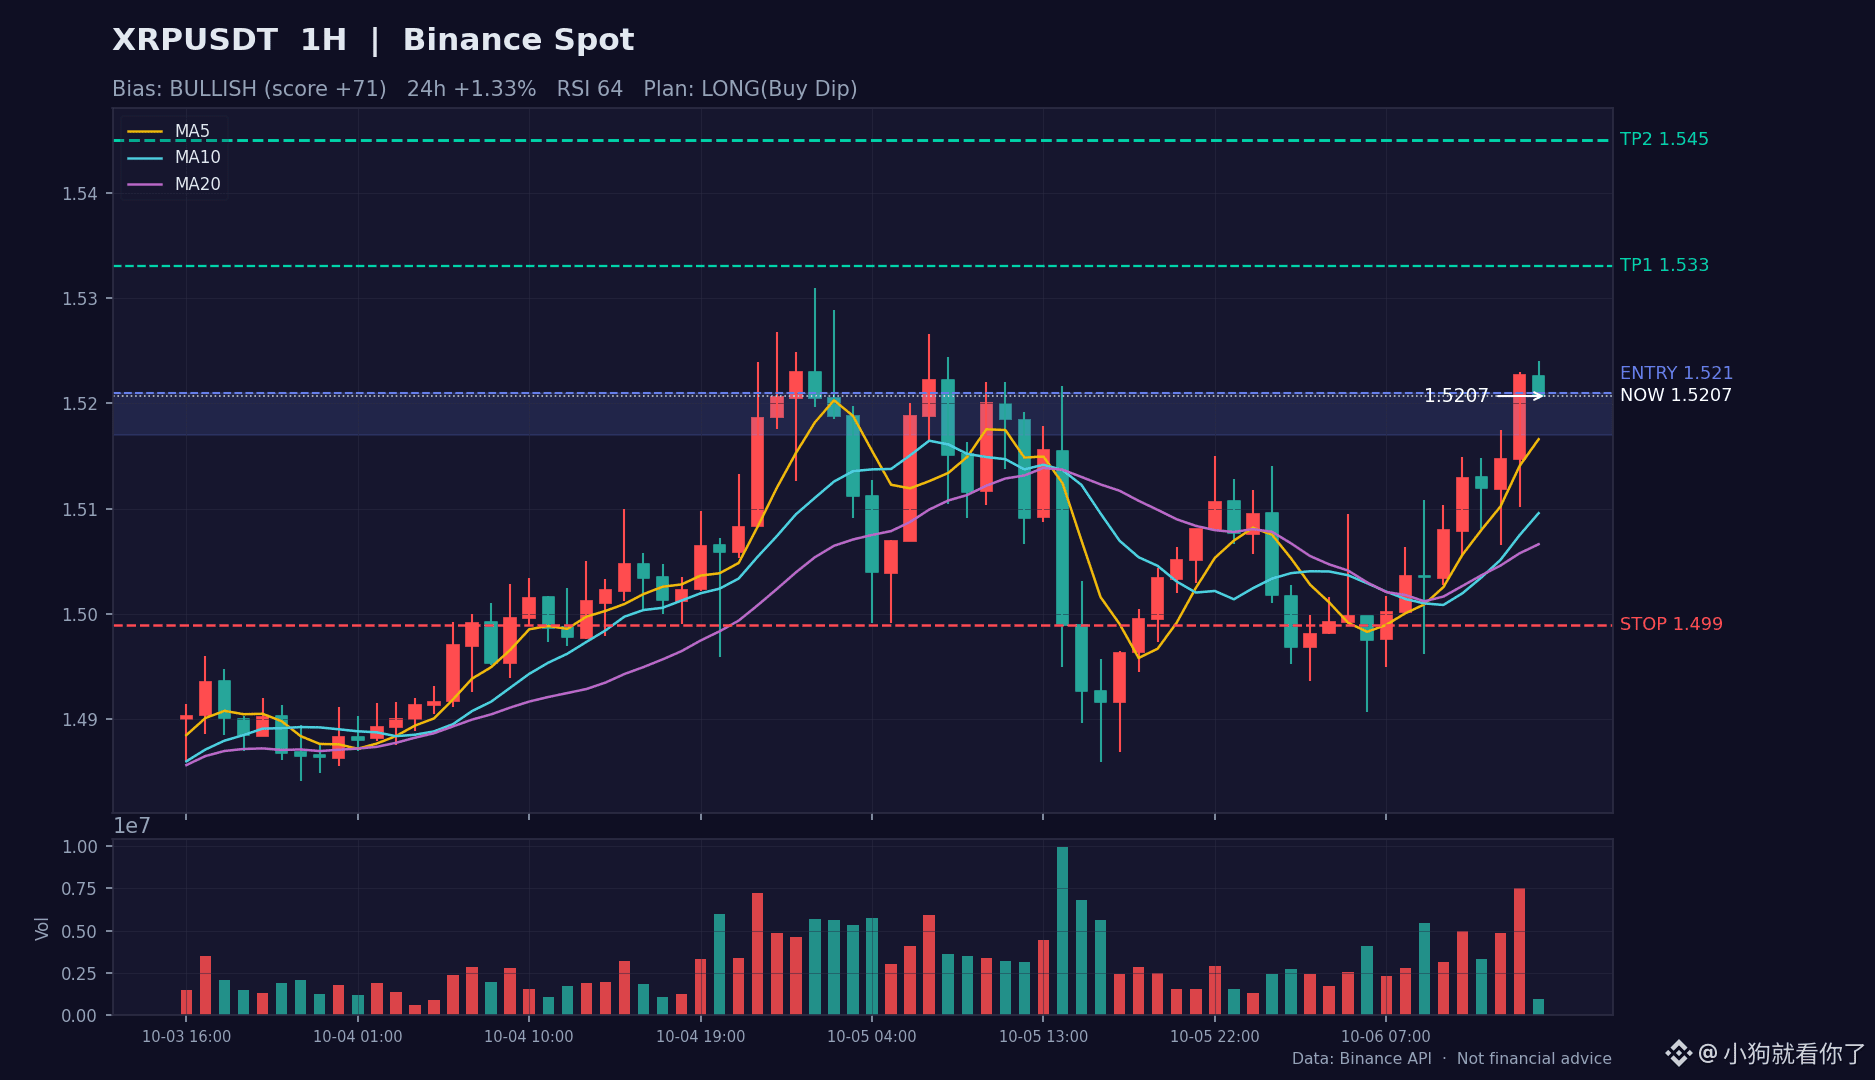
· Moving averages: MA5>MA10>MA20>MA60, a textbook bullish alignment, with short- and medium-term cost bases rising
· Momentum: The MACD fast line is above the zero line, with the histogram favoring bulls; bullish momentum is continuing. RSI (64) is strong but not overbought, and bullish momentum remains intact
· Pattern: Price is near the upper Bollinger Band, with a breakout or pullback just around the corner; volume is contracting (0.3 times average), so directional signals should be treated with caution in this low-volume environment
【Directional Outlook】
Overall score: 71/100. The structure leans bullish: moving averages and momentum indicators are converging to the upside. Until a pullback breaks below the lower boundary of the entry zone, the preference is to scale in on dips. A break above the previous high could open the way to the second target; a high-volume break below the stop-loss level invalidates this view.
【Trade Plan Reference】
· Strategy: Buy dips
· Entry zone: 1.517 ~ 1.521
· Take profit: First target 1.533, second target 1.545
· Stop loss: 1.499
· Position size: Small, 5%-10%; strictly exit if price falls below the stop-loss level
· Chart: Candlestick analysis chart included in the post (1-hour chart, red for up and green for down; entry zone/take-profit/stop-loss levels marked with colored lines)
【Risk Warning】Leveraged contracts can double your losses if you get the direction wrong. If you’ve set a stop loss in your plan, don’t move it manually.
This is only my personal review and technical analysis, and does not constitute investment advice. DYOR.
$XRP #XRP #加密货币 #MarketAnalysis
【Trending Event】
When a trending event and market action converge, it’s worth reviewing the data and news together.
“Circle, Ripple and Standard Chartered invest in OKX at $25 billion valuation” — Crypto.News reports that OKX has completed a strategic investment from Circle, Qube Research & Technologies, Ripple and Standard Charte…
The biggest risk with event-driven price action is overextended sentiment, so whether key levels hold matters more than the news itself.
【Market Snapshot】
$XRP is currently at 1.521, up 1.33% over 24 hours, with 24-hour trading volume of approximately 119.7M USDT.
【Technical Breakdown】
· Moving averages: MA5>MA10>MA20>MA60, a textbook bullish alignment, with short- and medium-term cost bases rising
· Momentum: The MACD fast line is above the zero line, with the histogram favoring bulls; bullish momentum is continuing. RSI (64) is strong but not overbought, and bullish momentum remains intact
· Pattern: Price is near the upper Bollinger Band, with a breakout or pullback just around the corner; volume is contracting (0.3 times average), so directional signals should be treated with caution in this low-volume environment
【Directional Outlook】
Overall score: 71/100. The structure leans bullish: moving averages and momentum indicators are converging to the upside. Until a pullback breaks below the lower boundary of the entry zone, the preference is to scale in on dips. A break above the previous high could open the way to the second target; a high-volume break below the stop-loss level invalidates this view.
【Trade Plan Reference】
· Strategy: Buy dips
· Entry zone: 1.517 ~ 1.521
· Take profit: First target 1.533, second target 1.545
· Stop loss: 1.499
· Position size: Small, 5%-10%; strictly exit if price falls below the stop-loss level
· Chart: Candlestick analysis chart included in the post (1-hour chart, red for up and green for down; entry zone/take-profit/stop-loss levels marked with colored lines)
【Risk Warning】Leveraged contracts can double your losses if you get the direction wrong. If you’ve set a stop loss in your plan, don’t move it manually.
This is only my personal review and technical analysis, and does not constitute investment advice. DYOR.
$XRP #XRP #加密货币 #MarketAnalysis