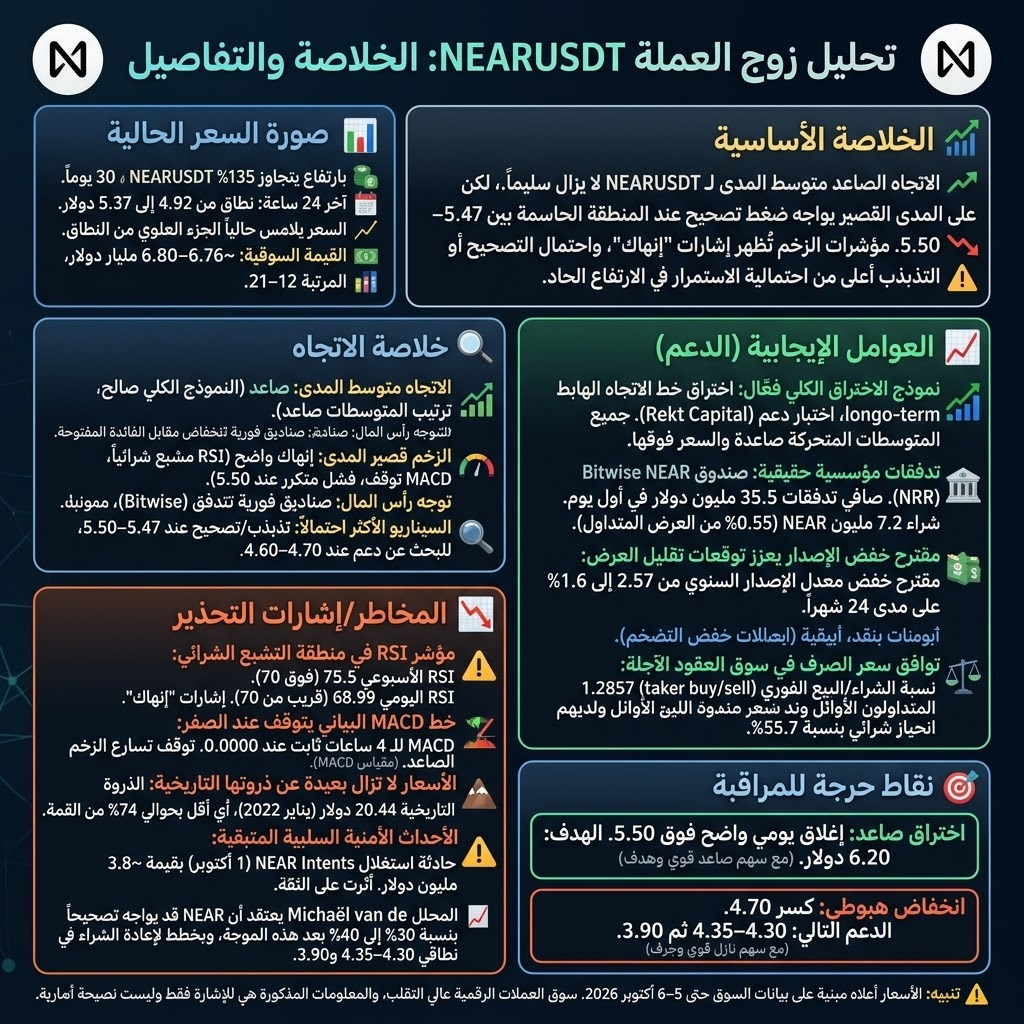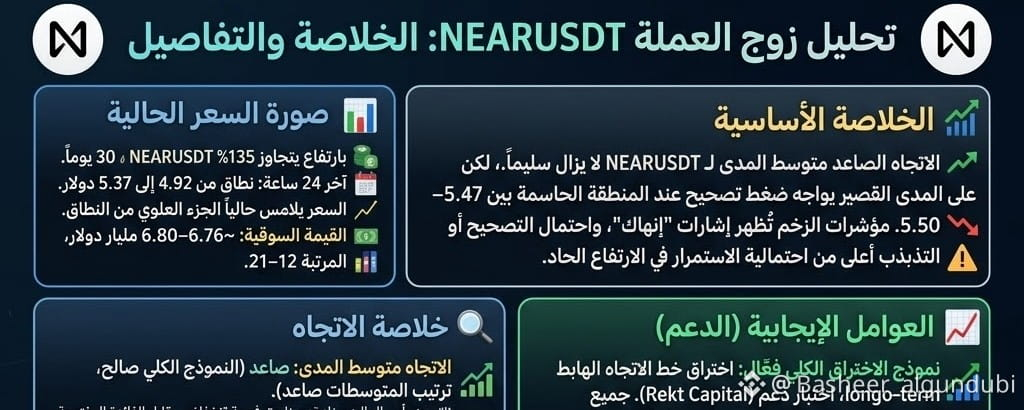

Key takeaway: The medium-term uptrend for #NEARUSDT remains intact, but in the short term it is facing corrective pressure in the critical 5.47–5.50 zone. Momentum indicators are showing signs of “exhaustion,” and a correction or sideways trading is more likely than a sharp continuation higher.
📊 Current price snapshot
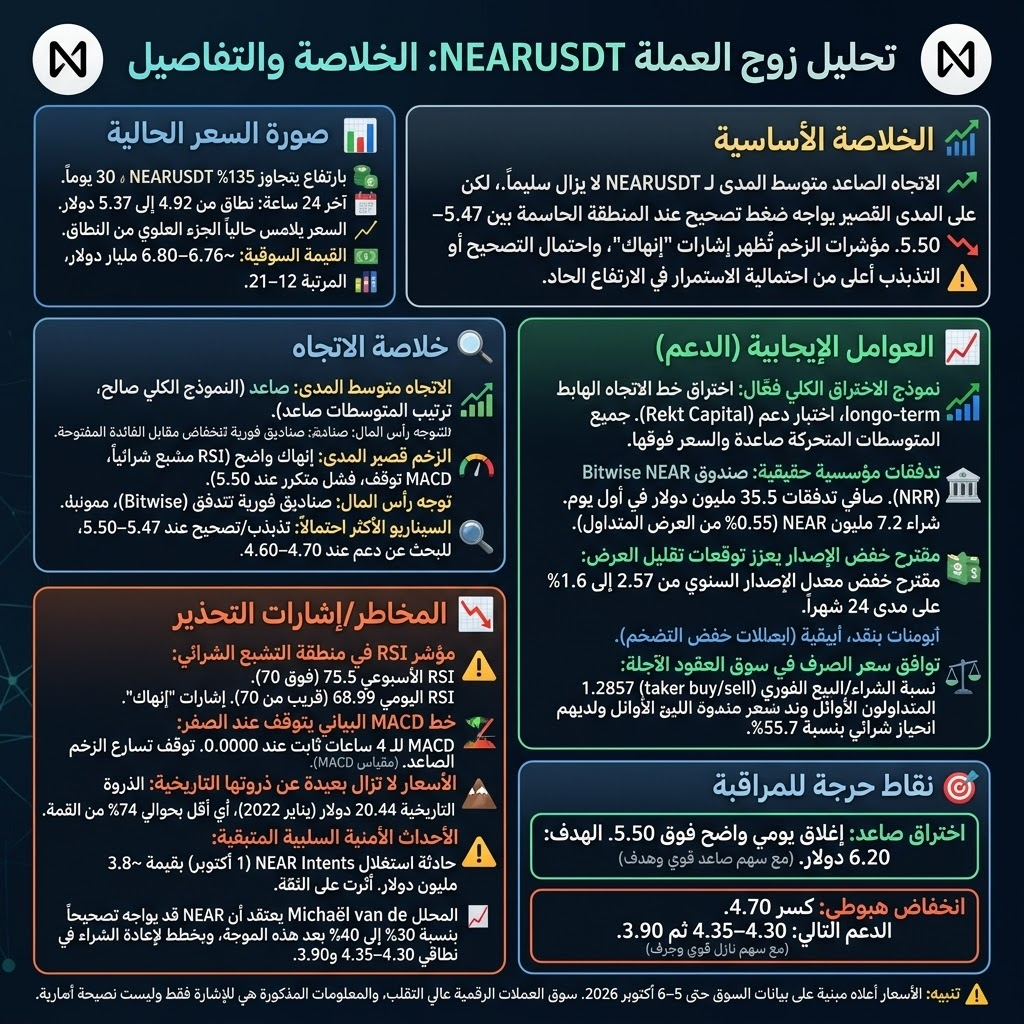
#NEAR is currently near $5.30, up more than 135% over the past 30 days. Over the last 24 hours, it traded between $4.92 and $5.37, and the price is currently touching the upper end of the range.
With a market capitalization of around $6.76–$6.80 billion, it ranks between 12th and 21st among cryptocurrencies.
📈 Positive Factors (Support)
1. The macro breakout pattern remains valid
$NEAR It broke above a long-term downtrend line that had held for years and is now retesting it as support. Analyst Rekt Capital considers this an “early sign” of a new macro uptrend. All moving averages (7-day, 20-day, 50-day, and 200-day) are aligned bullishly, and the price is hovering above them all.
2. Genuine institutional inflows
The Bit..wise NEAR spot ETF (ticker: NRR) recorded net inflows of $35.5 million on its first trading day, September 29, and bought about 7.2 million NEAR (roughly 0.55% of the circulating supply). This kind of genuine spot inflow reduces available supply; it is not merely “fake derivatives trading.”
3. The proposed issuance cut strengthens expectations of reduced supply
A governance forum proposal would cut the annual issuance rate from 2.5% to 1.6% over 24 months, reducing the number of new tokens issued from around 89,500 per day. The proposal would reduce dilution for holders who do not participate in staking.
4. Futures market exchange-rate alignment
The spot taker buy/sell ratio is 1.2857, and early traders (“smart money”) have a 55.7% buying bias. There is currently no serious selling pressure in the market.
📉 Risks/Warning Signals (Constraints)
1. RSI is in overbought territory
The weekly RSI is at 75.5, above the classic threshold of 70. This does not mean an immediate reversal, but it suggests that the pace of the rise is “extremely rapid,” leaving less room to continue at the same speed. The daily RSI is at 68.99, very close to 70.
2. The MACD histogram is stalling at zero
The 4-hour MACD on #Binance_histogram is completely flat at 0.0000, meaning that the acceleration of upward momentum has come to a complete stop. Buyers have not lost control, but they have clearly stalled at resistance.
3. Prices remain far below their all-time high
The current price is $5.30, while the all-time high is $20.44 (January 2022), meaning it is about 74% below the peak. The recovery path is a long one.
4. Lingering negative security incidents
The #NEAR_Intents exploit on October 1 (about $3.8 million) caused the price to fall from 5.50 to 4.70. Although the mainnet was unaffected and the funds were recovered, confidence was shaken, and some cross-chain channels are still operating with limitations.
🔍 Trend Summary
Dimension | Current status
Medium-term trend: bullish (macro pattern intact, moving averages aligned bullishly)
Short-term momentum: clear signs of exhaustion (overbought RSI, MACD stalling, repeated failures at 5.50)
Capital flows: spot ETFs are seeing inflows, but futures open interest fell by 3.72%; there is no new leverage
Most likely scenario: consolidation/correction around 5.47–5.50, with support sought at 4.70–4.60
Dimension | Current status
Medium-term trend: bullish (macro pattern intact, moving averages aligned bullishly)
Short-term momentum: clear signs of exhaustion (overbought RSI, MACD stalling, repeated failures at 5.50)
Capital flows: spot ETFs are seeing inflows, but futures open interest fell by 3.72%; there is no new leverage
Most likely scenario: consolidation/correction around 5.47–5.50, with support sought at 4.70–4.60
Key points to watch:
· Bullish breakout: a clear daily close above 5.50 would open the way toward $6.20
· Bearish breakdown: a break below 4.70 puts the next level at 4.30–4.35, followed by 3.90
Analyst Mich..aël van de Poppe believes that $NEAR could face a 30%–40% correction after this rally and plans to buy back in the 4.30–4.35 and 3.90 ranges.
⚠️ Notice: The prices above are based on market data through October 5–6, 2026. The cryptocurrency market is highly volatile, and the information provided is for reference only and is not investment advice.