【$SOL Key-Level Showdown: Bull-Bear Tug-of-War Conditions and Invalidation Criteria, Clearly Explained】
【Hot News】
I just saw this news and immediately pulled up the SOLUSDT chart to compare.
“Solana Foundation targets settlement in seconds with DvP launch” — Cointelegraph reports that Solana DvP offers financial institutions an open-source settlement program designed to complete asset transfers…
The news brings volatility; market structure determines direction. You need both.
【Market Snapshot】
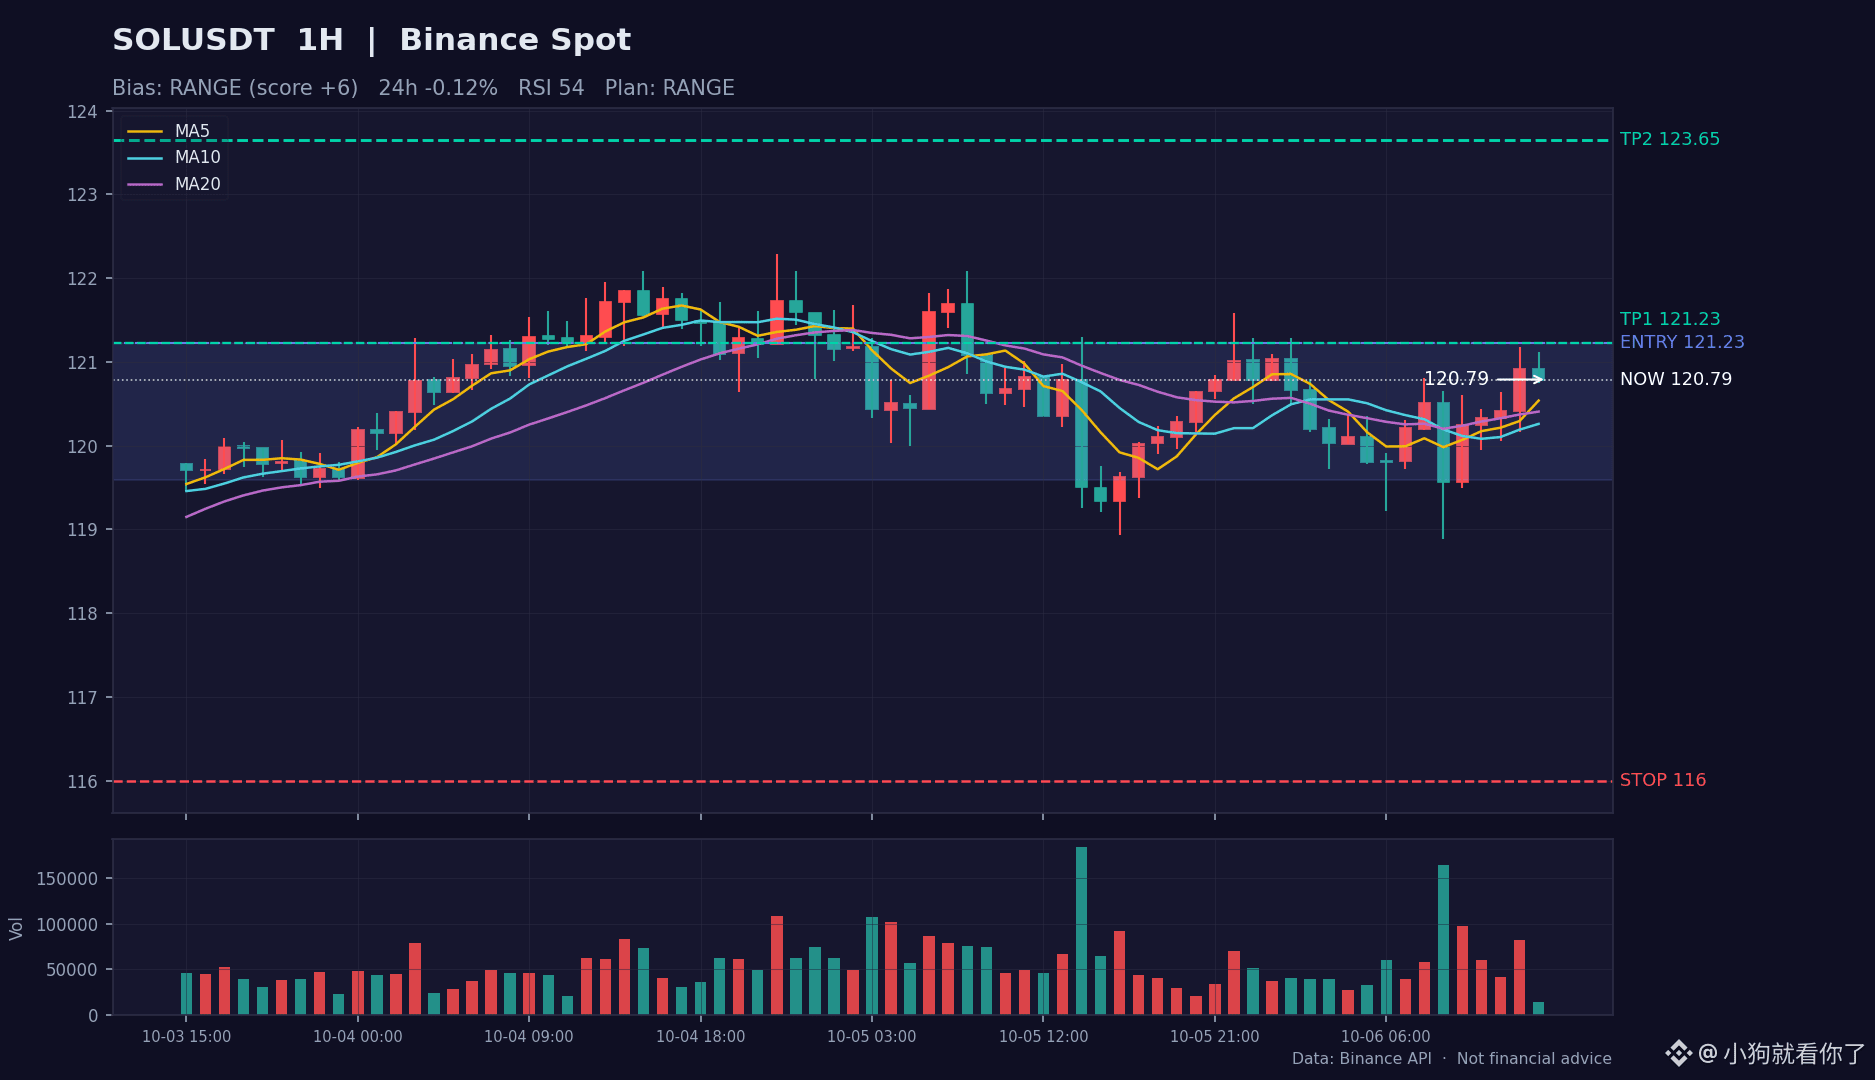
$SOL is currently at 120.79, down 0.12% over 24 hours, with 24-hour trading volume of approximately 175.2M USDT.
【Technical Breakdown】
· Moving averages: Short-term moving averages have formed a golden cross, and price has moved back above MA20. The trend is recovering, but MA60 has yet to be reclaimed.
· Momentum: The MACD fast line is above zero, with red bars dominant, indicating that bullish momentum is still continuing. RSI (54) is neutral to slightly weak; bulls and bears are still battling it out.
· Pattern: Price is hovering near the Bollinger midline, whose reclaim or loss will determine the short-term pace. Volume is contracting (0.3 times the average), so directional signals should be treated with caution in these low-volume conditions.
【Directional Outlook】
Overall score: 6/100. Bulls and bears are locked in a tug-of-war: indicators are conflicting. The biggest mistake right now would be chasing trades. Consider a range-bound approach, lightly selling near the top and buying near the bottom, then follow the move once direction is chosen (a high-volume breakout above or below the range).
【Trading Plan Reference】
· Approach: Range-bound
· Entry zone: 119.59 ~ 121.23
· Take profit: First target 121.23, second target 123.65
· Stop loss: 116.00
· Position sizing: Use light positions to sell near the top and buy near the bottom of the range; follow the trend after a breakout.
· Chart: The candlestick analysis chart is included in the post (1-hour chart, red for up and green for down; entry zone, take-profit, and stop-loss levels are marked with colored lines).
【Risk Warning】Leveraged contracts amplify losses: getting the direction wrong can hurt twice as much. Once you’ve placed your stop loss as planned, don’t move it manually.
This is only my personal review and technical analysis log, and does not constitute investment advice. DYOR.
$SOL #SOL #加密货币 #MarketAnalysis
【Hot News】
I just saw this news and immediately pulled up the SOLUSDT chart to compare.
“Solana Foundation targets settlement in seconds with DvP launch” — Cointelegraph reports that Solana DvP offers financial institutions an open-source settlement program designed to complete asset transfers…
The news brings volatility; market structure determines direction. You need both.
【Market Snapshot】
$SOL is currently at 120.79, down 0.12% over 24 hours, with 24-hour trading volume of approximately 175.2M USDT.
【Technical Breakdown】
· Moving averages: Short-term moving averages have formed a golden cross, and price has moved back above MA20. The trend is recovering, but MA60 has yet to be reclaimed.
· Momentum: The MACD fast line is above zero, with red bars dominant, indicating that bullish momentum is still continuing. RSI (54) is neutral to slightly weak; bulls and bears are still battling it out.
· Pattern: Price is hovering near the Bollinger midline, whose reclaim or loss will determine the short-term pace. Volume is contracting (0.3 times the average), so directional signals should be treated with caution in these low-volume conditions.
【Directional Outlook】
Overall score: 6/100. Bulls and bears are locked in a tug-of-war: indicators are conflicting. The biggest mistake right now would be chasing trades. Consider a range-bound approach, lightly selling near the top and buying near the bottom, then follow the move once direction is chosen (a high-volume breakout above or below the range).
【Trading Plan Reference】
· Approach: Range-bound
· Entry zone: 119.59 ~ 121.23
· Take profit: First target 121.23, second target 123.65
· Stop loss: 116.00
· Position sizing: Use light positions to sell near the top and buy near the bottom of the range; follow the trend after a breakout.
· Chart: The candlestick analysis chart is included in the post (1-hour chart, red for up and green for down; entry zone, take-profit, and stop-loss levels are marked with colored lines).
【Risk Warning】Leveraged contracts amplify losses: getting the direction wrong can hurt twice as much. Once you’ve placed your stop loss as planned, don’t move it manually.
This is only my personal review and technical analysis log, and does not constitute investment advice. DYOR.
$SOL #SOL #加密货币 #MarketAnalysis