Technical analysis of INJ/USDT (4h time frame)
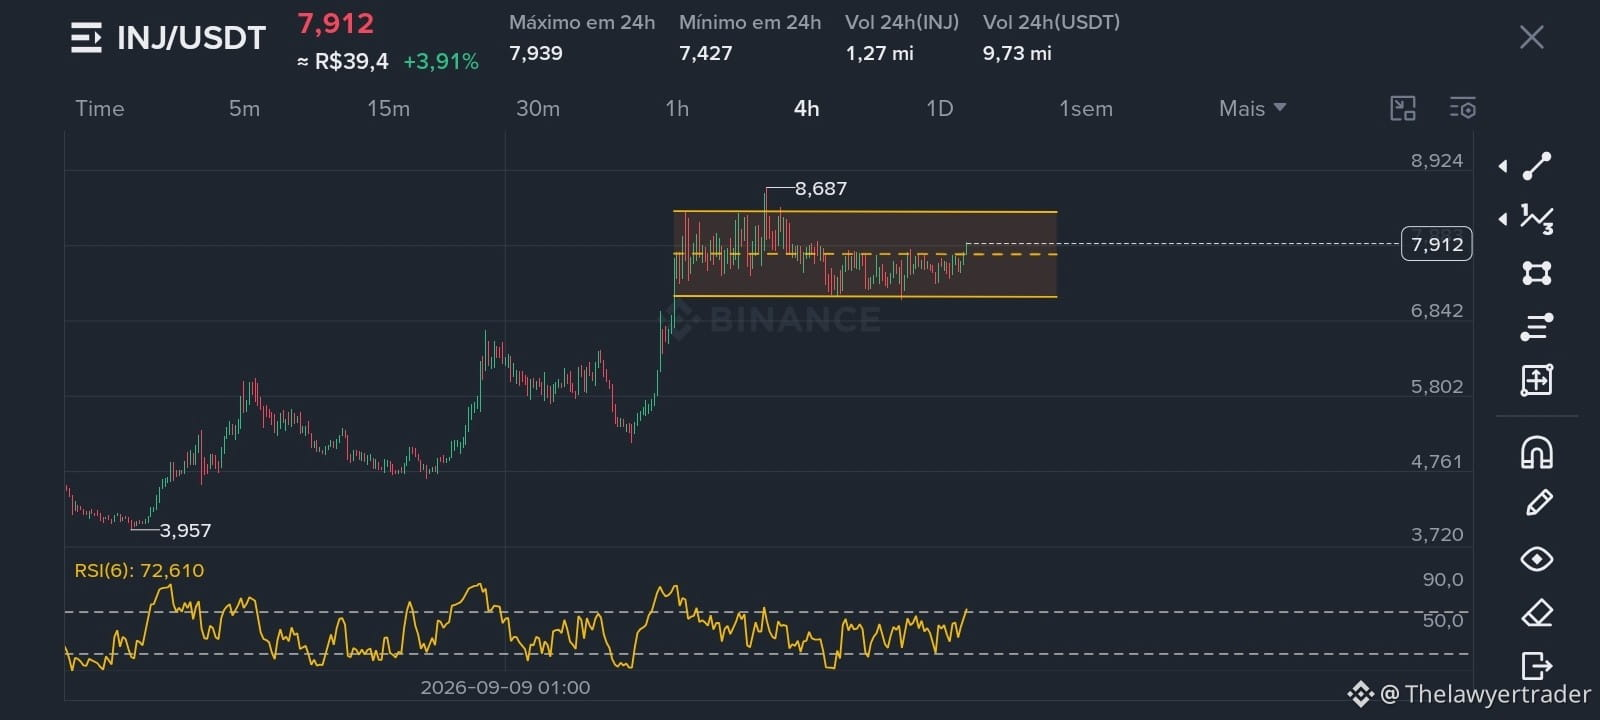
INJ is showing a medium-term uptrend, rising from a low of 3.957 and consolidating after a strong impulsive move. At the time of capture, the price was trading around 7.912, positioned in the upper half of the consolidation rectangle.
The visible chart pattern is a sideways consolidation (range), with the asset fluctuating between resistance near 8.687 and support at the bottom of the range, around the 6.800 zone. The price is testing a central line (pivot) drawn on the chart, which often determines the next directional move.
The RSI(6) indicator is at 72.610, indicating short-term overbought conditions. This suggests caution with new long entries within this congestion zone, as buying pressure may become exhausted before an attempted breakout.
Scenarios to watch:
A breakout above resistance at 8.687 could indicate that the uptrend is continuing, opening the way for new highs.
A loss of support at 6.800 could signal a deeper correction, with the price seeking lower levels.
The decisive point is how the range resolves:
As long as the price neither breaks through resistance nor loses support, the trend remains undefined within the range.
Remember that chart analysis indicates probabilities, not certainties, and this analysis does not constitute a recommendation to buy or sell.
#Injective🔥 $INJ
INJ is showing a medium-term uptrend, rising from a low of 3.957 and consolidating after a strong impulsive move. At the time of capture, the price was trading around 7.912, positioned in the upper half of the consolidation rectangle.
The visible chart pattern is a sideways consolidation (range), with the asset fluctuating between resistance near 8.687 and support at the bottom of the range, around the 6.800 zone. The price is testing a central line (pivot) drawn on the chart, which often determines the next directional move.
The RSI(6) indicator is at 72.610, indicating short-term overbought conditions. This suggests caution with new long entries within this congestion zone, as buying pressure may become exhausted before an attempted breakout.
Scenarios to watch:
A breakout above resistance at 8.687 could indicate that the uptrend is continuing, opening the way for new highs.
A loss of support at 6.800 could signal a deeper correction, with the price seeking lower levels.
The decisive point is how the range resolves:
As long as the price neither breaks through resistance nor loses support, the trend remains undefined within the range.
Remember that chart analysis indicates probabilities, not certainties, and this analysis does not constitute a recommendation to buy or sell.
#Injective🔥 $INJ