🚀 $RAD / USDT Technical Analysis – 15m Chart 📊
Current Price: $0.359 (+34.96%)
24h High / Low: $0.436 / $0.261
🔍 Market Overview:
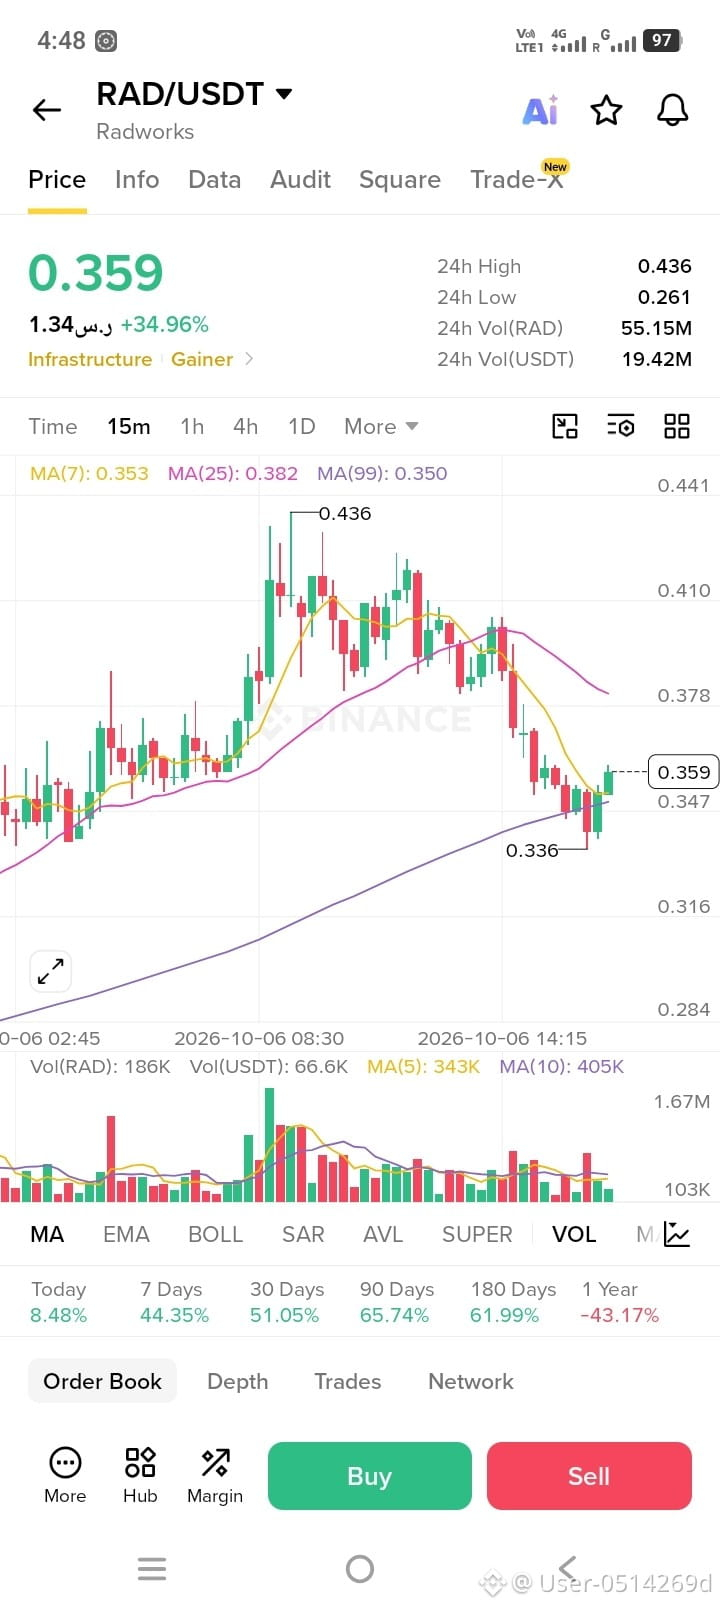
The RAD token surged strongly, reaching a high of $0.436, followed by heavy profit-taking and rejection. The price dropped to $0.336 and is now attempting to bounce back and recover from there.
📉 Key Technical Levels:
🟢 Immediate Support: $0.336 - $0.350 (support area around MA 99 and the recent swing low)
🔴 Immediate Resistance: $0.382 (the MA 25 line, currently acting as overhead resistance)
🎯 Major Resistance / Target: $0.410 - $0.436
📈 Indicator Signals:
Moving Averages (MA):
MA(7) ($0.353): The price is currently trying to cross above the short-term MA(7).
MA(99) ($0.350): MA(99) prevented the price from falling further and created a solid floor.
Volume: Volume was high during the breakout, but it is comparatively low/normal in the current consolidation phase.
$RAD
Current Price: $0.359 (+34.96%)
24h High / Low: $0.436 / $0.261
🔍 Market Overview:
The RAD token surged strongly, reaching a high of $0.436, followed by heavy profit-taking and rejection. The price dropped to $0.336 and is now attempting to bounce back and recover from there.
📉 Key Technical Levels:
🟢 Immediate Support: $0.336 - $0.350 (support area around MA 99 and the recent swing low)
🔴 Immediate Resistance: $0.382 (the MA 25 line, currently acting as overhead resistance)
🎯 Major Resistance / Target: $0.410 - $0.436
📈 Indicator Signals:
Moving Averages (MA):
MA(7) ($0.353): The price is currently trying to cross above the short-term MA(7).
MA(99) ($0.350): MA(99) prevented the price from falling further and created a solid floor.
Volume: Volume was high during the breakout, but it is comparatively low/normal in the current consolidation phase.
$RAD