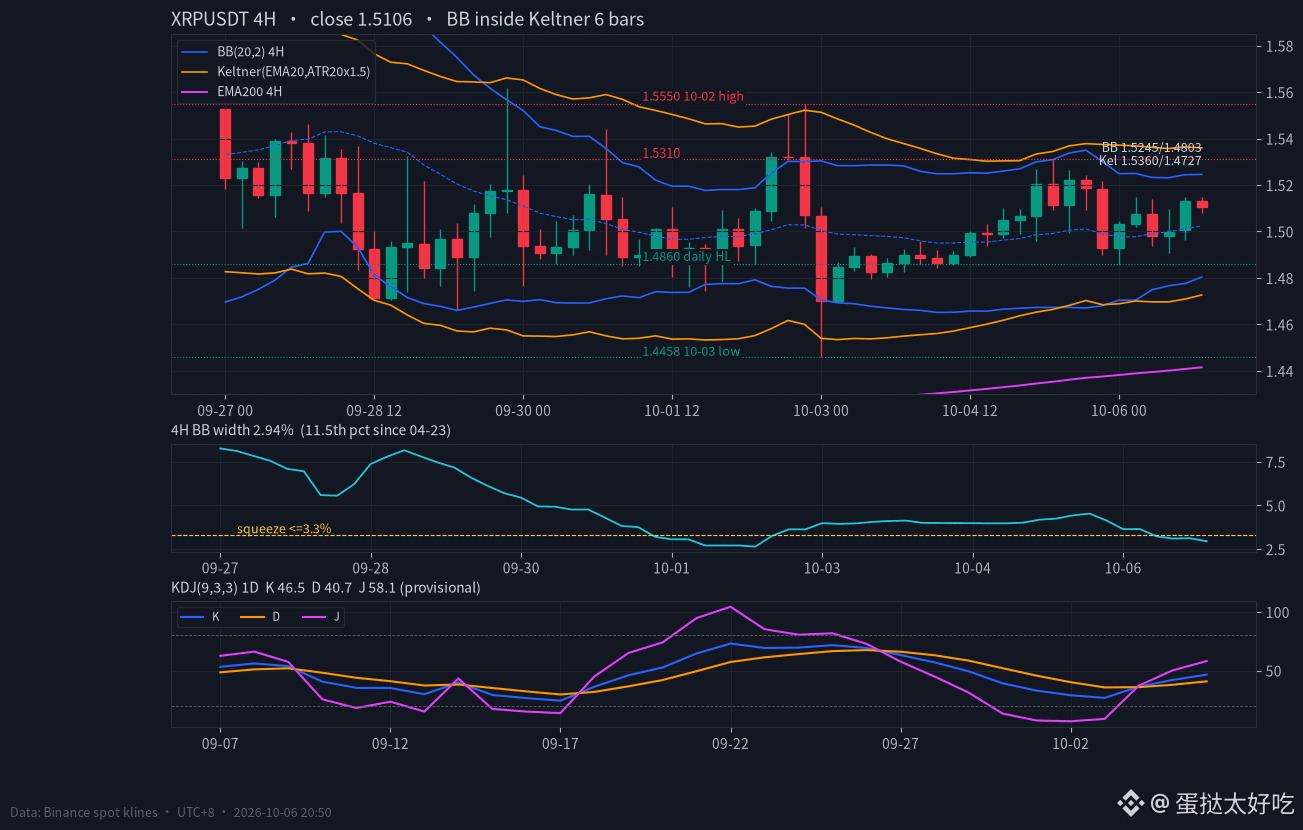
The $XRP 4-hour Bollinger Band width squeezed to 2.94%. Everyone says the direction after a squeeze is anyone’s guess. I reviewed 1,000 four-hour candles since late April: the direction isn’t random—watch which side of the EMA200 price is squeezed on.
The band width fell below 3.3% 13 times from May to October. In 11 cases, price was below the four-hour EMA200, and it first closed below the lower band. In the other two cases, price was above it (September 8 and October 1), and both times it moved up first, gaining as much as 3.5% and 3.6% over 48 hours. Price is now at 1.5106, with the EMA200 at 1.4415 and the EMA50 at 1.5018—both below price.
Four-hour Bollinger Bands (20,2): middle band 1.5024, upper band 1.5245, lower band 1.4803. For six consecutive candles, the bands have contracted inside the Keltner Channel (EMA20, ATR20×1.5), whose upper band is 1.5360 and lower band is 1.4727. Daily KDJ (9,3,3): K=46.5, D=40.7, J=58.1. J has climbed from 6.7 on October 2 and is still far from overbought.
Since 21:00 on October 3, OI has risen from 314.7 million coins to 321.8 million (+2.3%). The top traders’ long/short position ratio rose from 2.00 to 2.41, while the retail accounts’ long/short ratio fell from 2.69 to 2.15. The funding rate dropped from a sustained 0.01% to 0.0025%, so those adding positions aren’t paying a high rate.
Daily lows have been rising steadily: 1.4458, 1.4795, 1.4856, 1.4860, 1.4907. Highs have been squeezed down from 1.5550 to 1.5149, and the triangle is nearing its apex. The pullback I was watching yesterday only reached 1.4860 before bouncing back.
I lean toward an upside move this time: first a four-hour close above 1.5245, then watch 1.5310 and 1.5550. The last time, on October 1, price spiked to 1.5550 and then plunged to 1.4458 on the next four-hour candle. So a brief break above doesn’t count; a sustained daily close above 1.5310 would be the real breakout. If the daily candle breaks below 1.4860, the triangle has chosen the downside.
#XRP #TechnicalAnalysis
The band width fell below 3.3% 13 times from May to October. In 11 cases, price was below the four-hour EMA200, and it first closed below the lower band. In the other two cases, price was above it (September 8 and October 1), and both times it moved up first, gaining as much as 3.5% and 3.6% over 48 hours. Price is now at 1.5106, with the EMA200 at 1.4415 and the EMA50 at 1.5018—both below price.
Four-hour Bollinger Bands (20,2): middle band 1.5024, upper band 1.5245, lower band 1.4803. For six consecutive candles, the bands have contracted inside the Keltner Channel (EMA20, ATR20×1.5), whose upper band is 1.5360 and lower band is 1.4727. Daily KDJ (9,3,3): K=46.5, D=40.7, J=58.1. J has climbed from 6.7 on October 2 and is still far from overbought.
Since 21:00 on October 3, OI has risen from 314.7 million coins to 321.8 million (+2.3%). The top traders’ long/short position ratio rose from 2.00 to 2.41, while the retail accounts’ long/short ratio fell from 2.69 to 2.15. The funding rate dropped from a sustained 0.01% to 0.0025%, so those adding positions aren’t paying a high rate.
Daily lows have been rising steadily: 1.4458, 1.4795, 1.4856, 1.4860, 1.4907. Highs have been squeezed down from 1.5550 to 1.5149, and the triangle is nearing its apex. The pullback I was watching yesterday only reached 1.4860 before bouncing back.
I lean toward an upside move this time: first a four-hour close above 1.5245, then watch 1.5310 and 1.5550. The last time, on October 1, price spiked to 1.5550 and then plunged to 1.4458 on the next four-hour candle. So a brief break above doesn’t count; a sustained daily close above 1.5310 would be the real breakout. If the daily candle breaks below 1.4860, the triangle has chosen the downside.
#XRP #TechnicalAnalysis