PUMP at $0.0063—are you willing to bet on it?
First, the surface picture: it climbed from $0.00115 to $0.0068, more than tripling in three months. It’s up 26% over the past 7 days and 58% over the past 30 days. So what happened next? Yesterday it was $0.0064; today it’s $0.0063—just grinding sideways. “Pump it already, you loser!”
First: The buybacks are real, but they’re not a price floor.
Pump.fun spends 50% of its net revenue each day buying PUMP on the market, then permanently burns it, with the smart contract locked for a year. By the end of September, a cumulative $466 million had been spent, and 168.6 billion tokens had been burned—17% of the total supply.
It’s like throwing money into a fire. The flames may be roaring, but that doesn’t mean the price will rise.
In the first half of this year, the same mechanism spent $350 million on buybacks, yet the price still fell back near its launch price.
Don’t forget: roughly a third of the supply is held by insiders and related parties. There are already 464 billion tokens in circulation, and more tokens are being unlocked than are bought back each day.
Second: That 20% surge in September had nothing to do with you.
On September 28–29, PUMP jumped 20% in two days, rising from $0.0041 to $0.0060. Everyone online was shouting, “The bull market is back!”
But do you know what drove that surge? Increased token issuance + a short squeeze in derivatives + one ambiguous piece of guidance from SEC staff. It wasn’t a surge in fees or explosive revenue—just sentiment and leverage.
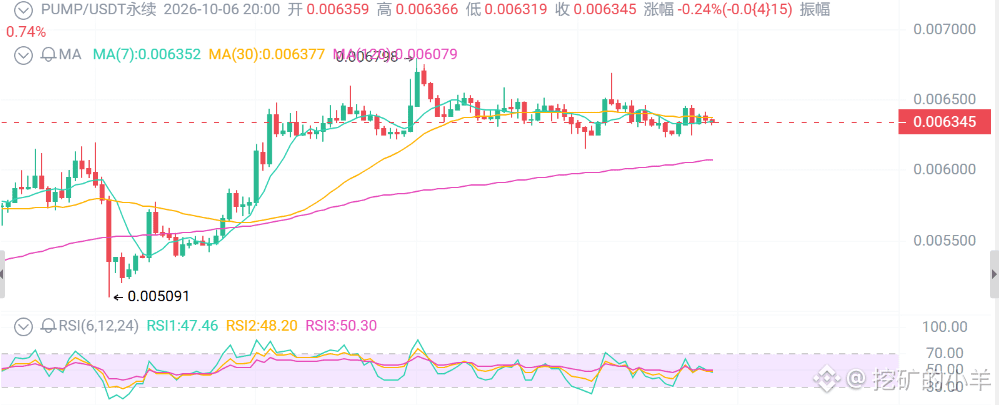
Third: The technicals are at a critical turning point. $0.0062 is make-or-break.
June low: $0.00115 → September 26: $0.0041 → September 29: $0.0060 → October 4 high: $0.00681 → now: $0.0063.
On the 4-hour chart, it’s trading within a $0.0062–$0.0068 range, with volume far lower than at the end of September.
If $0.0062 doesn’t hold, expect a sharp short-term pullback. A daily close below $0.0058, and $0.0051 comes into view.
Trading strategy
Short-term traders:
Try a very small long position around $0.0063, with a stop-loss at $0.00615. First target: $0.0066; second target: $0.0068. Take half off the table at $0.0065.
Conservative traders:
Wait for $0.0058–$0.0060 before considering an entry, with a stop-loss at $0.00545. A better entry zone is $0.0051–$0.0054.
Breakout traders:
Only consider chasing if price breaks above $0.00685 on strong volume and holds, then retests $0.0066 without breaking below it. Targets: $0.0072 and $0.0078. Walk away if it’s a false breakout.
Bears:
If price struggles to break higher around $0.0066–$0.0068, consider a small short position, with a stop-loss at $0.00695 and targets at $0.0062 and $0.0058.
First, the surface picture: it climbed from $0.00115 to $0.0068, more than tripling in three months. It’s up 26% over the past 7 days and 58% over the past 30 days. So what happened next? Yesterday it was $0.0064; today it’s $0.0063—just grinding sideways. “Pump it already, you loser!”
First: The buybacks are real, but they’re not a price floor.
Pump.fun spends 50% of its net revenue each day buying PUMP on the market, then permanently burns it, with the smart contract locked for a year. By the end of September, a cumulative $466 million had been spent, and 168.6 billion tokens had been burned—17% of the total supply.
It’s like throwing money into a fire. The flames may be roaring, but that doesn’t mean the price will rise.
In the first half of this year, the same mechanism spent $350 million on buybacks, yet the price still fell back near its launch price.
Don’t forget: roughly a third of the supply is held by insiders and related parties. There are already 464 billion tokens in circulation, and more tokens are being unlocked than are bought back each day.
Second: That 20% surge in September had nothing to do with you.
On September 28–29, PUMP jumped 20% in two days, rising from $0.0041 to $0.0060. Everyone online was shouting, “The bull market is back!”
But do you know what drove that surge? Increased token issuance + a short squeeze in derivatives + one ambiguous piece of guidance from SEC staff. It wasn’t a surge in fees or explosive revenue—just sentiment and leverage.
Third: The technicals are at a critical turning point. $0.0062 is make-or-break.
June low: $0.00115 → September 26: $0.0041 → September 29: $0.0060 → October 4 high: $0.00681 → now: $0.0063.
On the 4-hour chart, it’s trading within a $0.0062–$0.0068 range, with volume far lower than at the end of September.
If $0.0062 doesn’t hold, expect a sharp short-term pullback. A daily close below $0.0058, and $0.0051 comes into view.
Trading strategy
Short-term traders:
Try a very small long position around $0.0063, with a stop-loss at $0.00615. First target: $0.0066; second target: $0.0068. Take half off the table at $0.0065.
Conservative traders:
Wait for $0.0058–$0.0060 before considering an entry, with a stop-loss at $0.00545. A better entry zone is $0.0051–$0.0054.
Breakout traders:
Only consider chasing if price breaks above $0.00685 on strong volume and holds, then retests $0.0066 without breaking below it. Targets: $0.0072 and $0.0078. Walk away if it’s a false breakout.
Bears:
If price struggles to break higher around $0.0066–$0.0068, consider a small short position, with a stop-loss at $0.00695 and targets at $0.0062 and $0.0058.