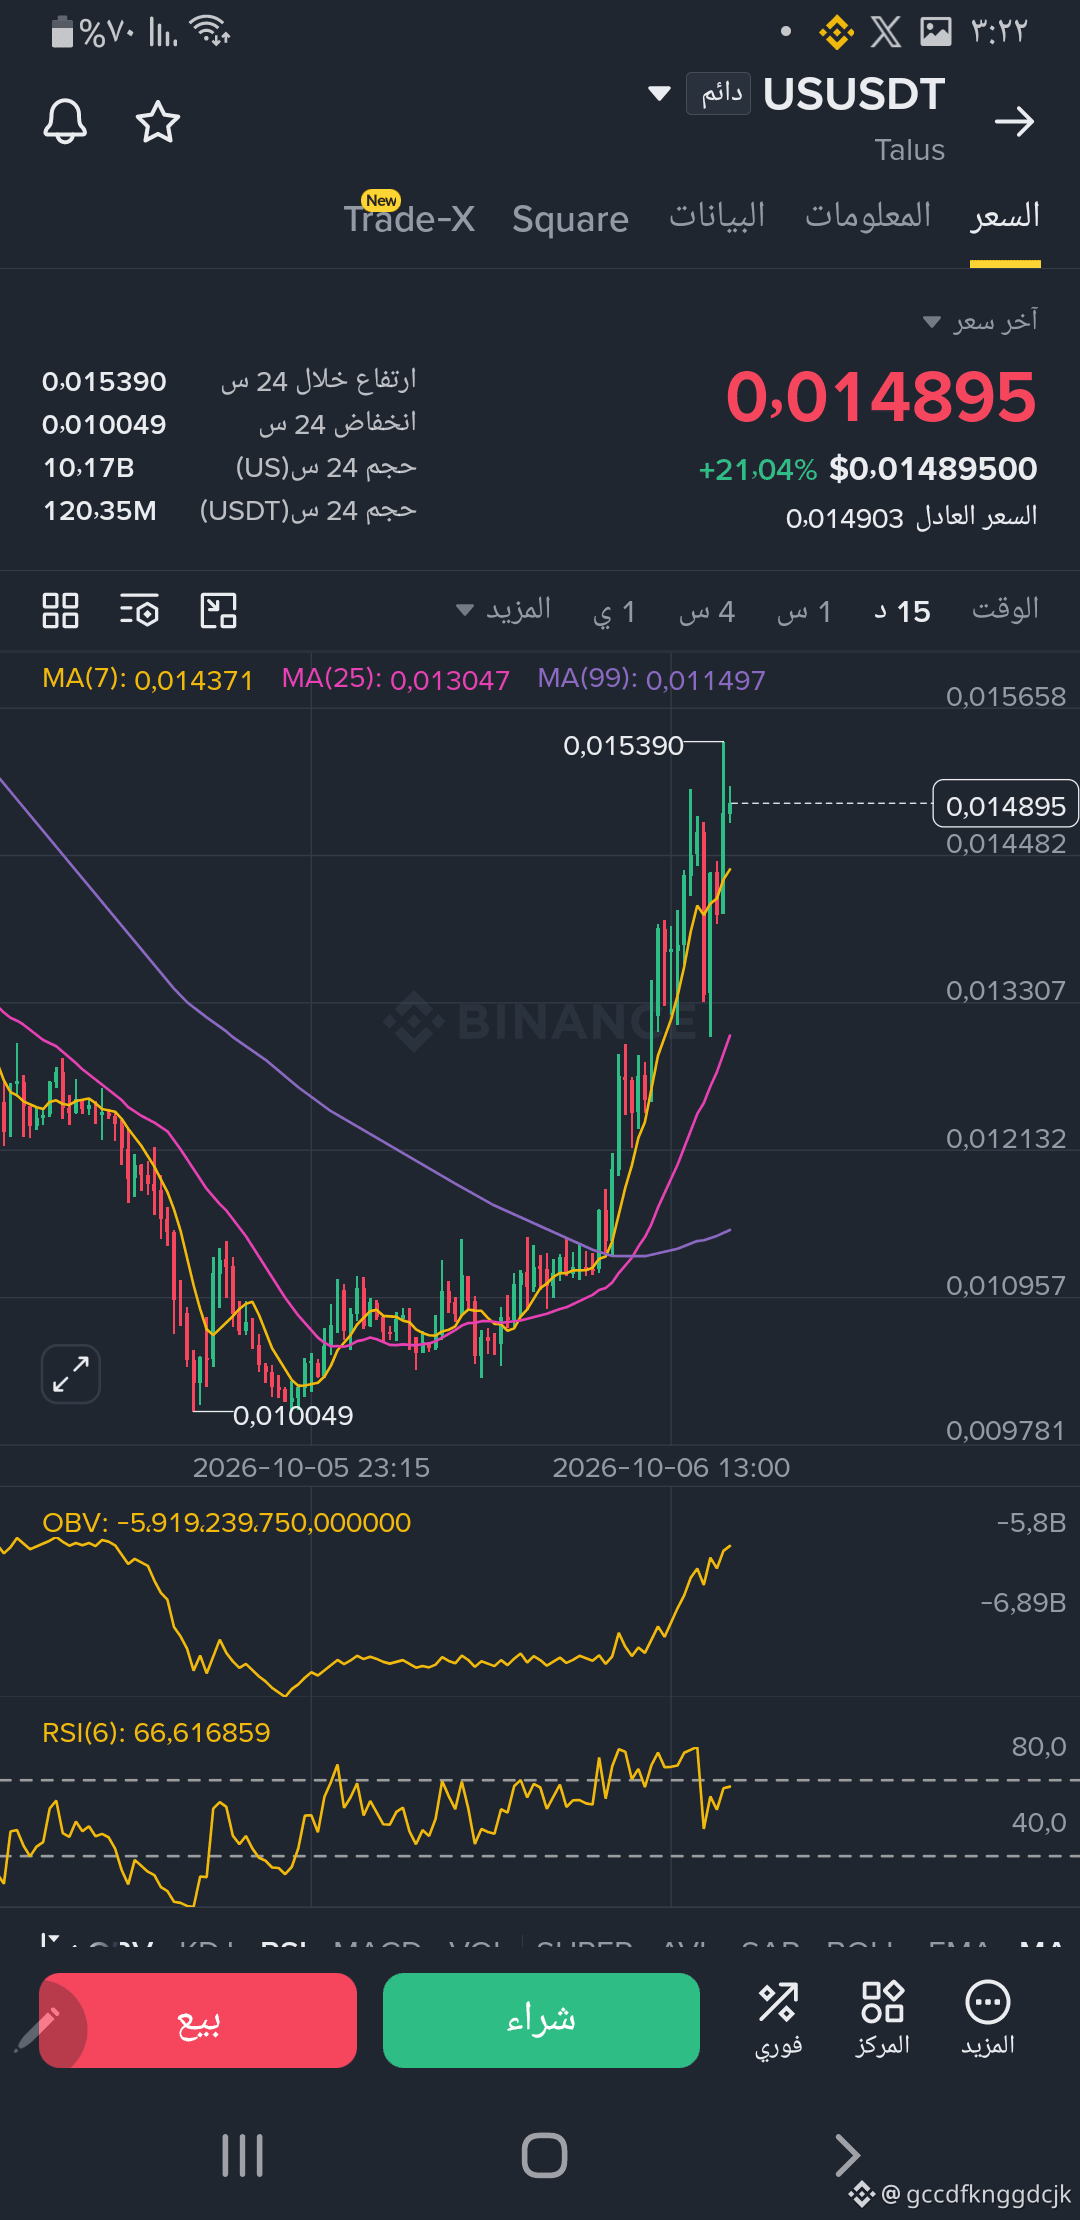
🚀 Coin $USDS ) posts a blazing +21.04% surge! Will the rally continue? 🔥📈
The 15-minute chart for US/USDT (Talus) shows very strong upward momentum and a price breakout after rebounding from a low of $0.010049 to reach $0.014895:
📌 Detailed technical analysis:
1️⃣ Strong bullish trend:
The price continues to rise strongly and is trading above all moving averages (MA7: 0.014371, MA25: 0.013047, MA99: 0.011497), reflecting buyers’ complete control in the short term.
The price reached a recent peak of $0.015390 before undergoing a slight correction to gather momentum.
2️⃣ Relative Strength Index (RSI):
The indicator is currently at 66.61. This means the price has excellent positive momentum while remaining below the extreme overbought zone (80+), leaving room for further gains.
3️⃣ On-Balance Volume (OBV) and trading volume:
The OBV indicator is climbing sharply, alongside 24-hour trading volume exceeding 120.35M USDT and 10.17B coins, confirming a substantial influx of real liquidity supporting this rise.
🎯 Possible scenarios
Bullish scenario: If the price breaks through the 24-hour high of $0.015390 and holds above it, this could open the way to new highs around $0.0165 and beyond.
Correction scenario: If profit-taking occurs, $0.014371 (the MA7 average) is the first support level to watch on a retest
The 15-minute chart for US/USDT (Talus) shows very strong upward momentum and a price breakout after rebounding from a low of $0.010049 to reach $0.014895:
📌 Detailed technical analysis:
1️⃣ Strong bullish trend:
The price continues to rise strongly and is trading above all moving averages (MA7: 0.014371, MA25: 0.013047, MA99: 0.011497), reflecting buyers’ complete control in the short term.
The price reached a recent peak of $0.015390 before undergoing a slight correction to gather momentum.
2️⃣ Relative Strength Index (RSI):
The indicator is currently at 66.61. This means the price has excellent positive momentum while remaining below the extreme overbought zone (80+), leaving room for further gains.
3️⃣ On-Balance Volume (OBV) and trading volume:
The OBV indicator is climbing sharply, alongside 24-hour trading volume exceeding 120.35M USDT and 10.17B coins, confirming a substantial influx of real liquidity supporting this rise.
🎯 Possible scenarios
Bullish scenario: If the price breaks through the 24-hour high of $0.015390 and holds above it, this could open the way to new highs around $0.0165 and beyond.
Correction scenario: If profit-taking occurs, $0.014371 (the MA7 average) is the first support level to watch on a retest