【$BTC Market Update: Bullish Signals Summarized; Price Levels to Consider for Buying the Dip】
【Hot News】
This Cointelegraph flash report has been widely discussed in the community, and the market reacted quickly.
“Binance BTC outflows hit highest since mid-2023 as whales deposit stablecoins” — Cointelegraph reports that Binance BTC reserves have fallen by nearly 40,000 coins since September.
The biggest risk with news-driven moves is that sentiment gets overextended, so whether key levels hold matters more than the news itself.
【Market Snapshot】
$BTC is currently at 86,292, up 0.16% over 24 hours, with 24-hour trading volume of approximately 1.2B USDT.
【Technical Analysis】
· Moving averages: MA5>MA10>MA20>MA60, a classic bullish alignment, with short- and medium-term cost bases rising
· Momentum: The MACD fast line is above the zero line, with red bars dominant; bullish momentum is continuing. RSI (61) is strong but not overbought, and bullish momentum remains intact
· Pattern: Price is near the upper Bollinger Band, with a breakout or pullback hanging in the balance. Volume has contracted (0.1x the average), so directional signals should be treated with caution in this low-volume environment
【Directional Outlook】
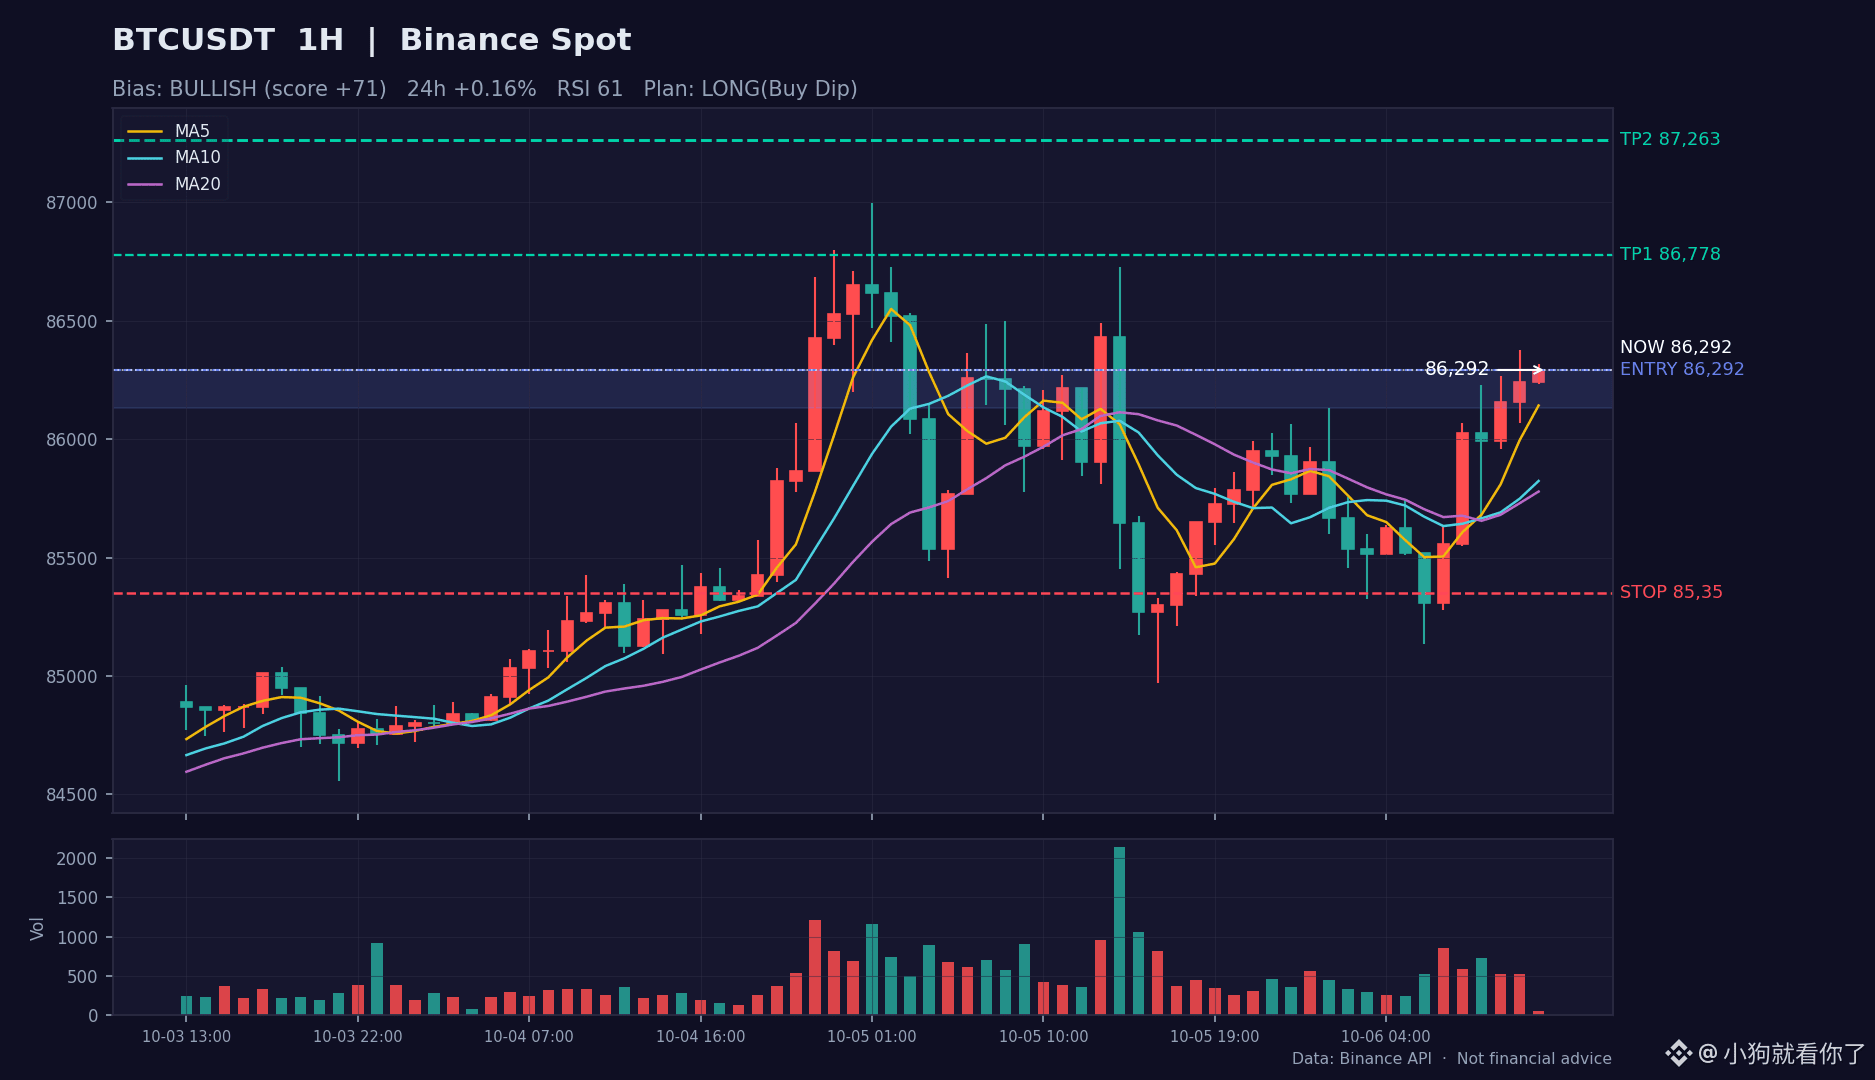
Overall score: 71/100. The structure leans bullish: moving averages and momentum indicators are aligned to the upside. Until a pullback breaks below the lower boundary of the entry zone, the preference is to scale in on dips; a break above the previous high could open the way to the second target. A high-volume break below the stop-loss level invalidates this outlook.
【Trade Plan Reference】
· Strategy: Buy dips
· Entry zone: 86,130 ~ 86,292
· Take profit: First target 86,778; second target 87,263
· Stop loss: 85,350
· Position size: Light, 5%-10%; strictly exit if price breaks below the stop-loss level
· Chart: The candlestick analysis chart is attached to the post (1-hour chart, red for up and green for down; the entry zone, take-profit levels, and stop loss are marked with colored lines)
【Risk Warning】Data represents probabilities, not a script. If any planned level is breached, exit first and reassess the rationale.
The above is for personal review and technical analysis only and does not constitute investment advice. DYOR.
$BTC #BTC #加密货币 #MarketAnalysis
【Hot News】
This Cointelegraph flash report has been widely discussed in the community, and the market reacted quickly.
“Binance BTC outflows hit highest since mid-2023 as whales deposit stablecoins” — Cointelegraph reports that Binance BTC reserves have fallen by nearly 40,000 coins since September.
The biggest risk with news-driven moves is that sentiment gets overextended, so whether key levels hold matters more than the news itself.
【Market Snapshot】
$BTC is currently at 86,292, up 0.16% over 24 hours, with 24-hour trading volume of approximately 1.2B USDT.
【Technical Analysis】
· Moving averages: MA5>MA10>MA20>MA60, a classic bullish alignment, with short- and medium-term cost bases rising
· Momentum: The MACD fast line is above the zero line, with red bars dominant; bullish momentum is continuing. RSI (61) is strong but not overbought, and bullish momentum remains intact
· Pattern: Price is near the upper Bollinger Band, with a breakout or pullback hanging in the balance. Volume has contracted (0.1x the average), so directional signals should be treated with caution in this low-volume environment
【Directional Outlook】
Overall score: 71/100. The structure leans bullish: moving averages and momentum indicators are aligned to the upside. Until a pullback breaks below the lower boundary of the entry zone, the preference is to scale in on dips; a break above the previous high could open the way to the second target. A high-volume break below the stop-loss level invalidates this outlook.
【Trade Plan Reference】
· Strategy: Buy dips
· Entry zone: 86,130 ~ 86,292
· Take profit: First target 86,778; second target 87,263
· Stop loss: 85,350
· Position size: Light, 5%-10%; strictly exit if price breaks below the stop-loss level
· Chart: The candlestick analysis chart is attached to the post (1-hour chart, red for up and green for down; the entry zone, take-profit levels, and stop loss are marked with colored lines)
【Risk Warning】Data represents probabilities, not a script. If any planned level is breached, exit first and reassess the rationale.
The above is for personal review and technical analysis only and does not constitute investment advice. DYOR.
$BTC #BTC #加密货币 #MarketAnalysis