

黑猫SabTheTrader
496 Posts

黑猫SabTheTrader
Report
Block User
👩💻4 Years NQ & Crypto Female Trader | 不管白猫黑猫,赚到钱的就是好猫 | X: SabTheTrader | Price action has the final say | 币安现货合约8折邀请码: SAB111
High-Frequency Trader
6.6 Years
185 Following
12.1K+ Followers
2.5K+ Liked
Posts
All
Quotes
Videos
Live
PINNED
U.S. stocks hit new highs again, so why hasn’t BTC caught up? 👀
On October 6 (U.S. Eastern Time), the S&P 500 rose 0.6% and the Nasdaq gained 0.4%, with both setting new closing records, while the small-cap index fell 0.6%.
This rally hasn’t lifted every asset along with it. Don’t assume crypto is about to catch up just because U.S. stocks hit new highs.
I’ll wait for $BTC to break out on its own, then pull back and hold before looking for a continuation. If it keeps lagging, let go of the idea that “it’s due for a turn” and keep your position size in check. Keep your position size in check.
{future}(BTCUSDT)
{future}(QQQUSDT)
U.S. stocks hit new highs again, so why hasn’t BTC caught up? 👀
On October 6 (U.S. Eastern Time), the S&P 500 rose 0.6% and the Nasdaq gained 0.4%, with both setting new closing records, while the small-cap index fell 0.6%.
This rally hasn’t lifted every asset along with it. Don’t assume crypto is about to catch up just because U.S. stocks hit new highs.
I’ll wait for $BTC to break out on its own, then pull back and hold before looking for a continuation. If it keeps lagging, let go of the idea that “it’s due for a turn” and keep your position size in check. Keep your position size in check.
On October 6 (U.S. Eastern Time), the S&P 500 rose 0.6% and the Nasdaq gained 0.4%, with both setting new closing records, while the small-cap index fell 0.6%.
This rally hasn’t lifted every asset along with it. Don’t assume crypto is about to catch up just because U.S. stocks hit new highs.
I’ll wait for $BTC to break out on its own, then pull back and hold before looking for a continuation. If it keeps lagging, let go of the idea that “it’s due for a turn” and keep your position size in check. Keep your position size in check.

9
2
1
117
PINNED
🐱 Black Cat Sab’s livestream schedule 🧡
I recently started livestreaming on Binance Square. Unless something comes up, I’ll be going live regularly:
🗓️ Monday to Friday
🕘 9:00–11:00 PM
My livestreams will mostly cover the things I do every day:
📈 Live Nasdaq NQ chart-watching
📝 Pre-market plans, key levels, and waiting for setups
🎯 Entry/exit ideas and price action
If I wrap up Nasdaq NQ early, we’ll also take a look at BTC, ETH, and whichever cryptocurrencies are active that evening.
My livestreams might be a little different from the more lively ones (welcome to an introvert’s livestream, haha).
Most of the time, I’ll just have some light music on while I watch the charts as usual. If there’s something worth discussing, I’ll share it. If there’s no suitable setup, we’ll wait together. I won’t force trades just for the livestream (●'◡'●) (Trading is really all about having patience, waiting, and managing your emotions.)
The livestream will mainly be in Chinese, but English is welcome too.
If I ever have to skip a livestream or change the schedule, I’ll let you know on Square in advance.
Monday to Friday, 9 PM.
If you want to see how I trade day to day, see you in the livestream. 🐱
🐱 Black Cat Sab’s livestream schedule 🧡
I recently started livestreaming on Binance Square. Unless something comes up, I’ll be going live regularly:
🗓️ Monday to Friday
🕘 9:00–11:00 PM
My livestreams will mostly cover the things I do every day:
📈 Live Nasdaq NQ chart-watching
📝 Pre-market plans, key levels, and waiting for setups
🎯 Entry/exit ideas and price action
If I wrap up Nasdaq NQ early, we’ll also take a look at BTC, ETH, and whichever cryptocurrencies are active that evening.
My livestreams might be a little different from the more lively ones (welcome to an introvert’s livestream, haha).
Most of the time, I’ll just have some light music on while I watch the charts as usual. If there’s something worth discussing, I’ll share it. If there’s no suitable setup, we’ll wait together. I won’t force trades just for the livestream (●'◡'●) (Trading is really all about having patience, waiting, and managing your emotions.)
The livestream will mainly be in Chinese, but English is welcome too.
If I ever have to skip a livestream or change the schedule, I’ll let you know on Square in advance.
Monday to Friday, 9 PM.
If you want to see how I trade day to day, see you in the livestream. 🐱
I recently started livestreaming on Binance Square. Unless something comes up, I’ll be going live regularly:
🗓️ Monday to Friday
🕘 9:00–11:00 PM
My livestreams will mostly cover the things I do every day:
📈 Live Nasdaq NQ chart-watching
📝 Pre-market plans, key levels, and waiting for setups
🎯 Entry/exit ideas and price action
If I wrap up Nasdaq NQ early, we’ll also take a look at BTC, ETH, and whichever cryptocurrencies are active that evening.
My livestreams might be a little different from the more lively ones (welcome to an introvert’s livestream, haha).
Most of the time, I’ll just have some light music on while I watch the charts as usual. If there’s something worth discussing, I’ll share it. If there’s no suitable setup, we’ll wait together. I won’t force trades just for the livestream (●'◡'●) (Trading is really all about having patience, waiting, and managing your emotions.)
The livestream will mainly be in Chinese, but English is welcome too.
If I ever have to skip a livestream or change the schedule, I’ll let you know on Square in advance.
Monday to Friday, 9 PM.
If you want to see how I trade day to day, see you in the livestream. 🐱

2.4k
17
126
2.4k


奋斗Hustle1688
·
--
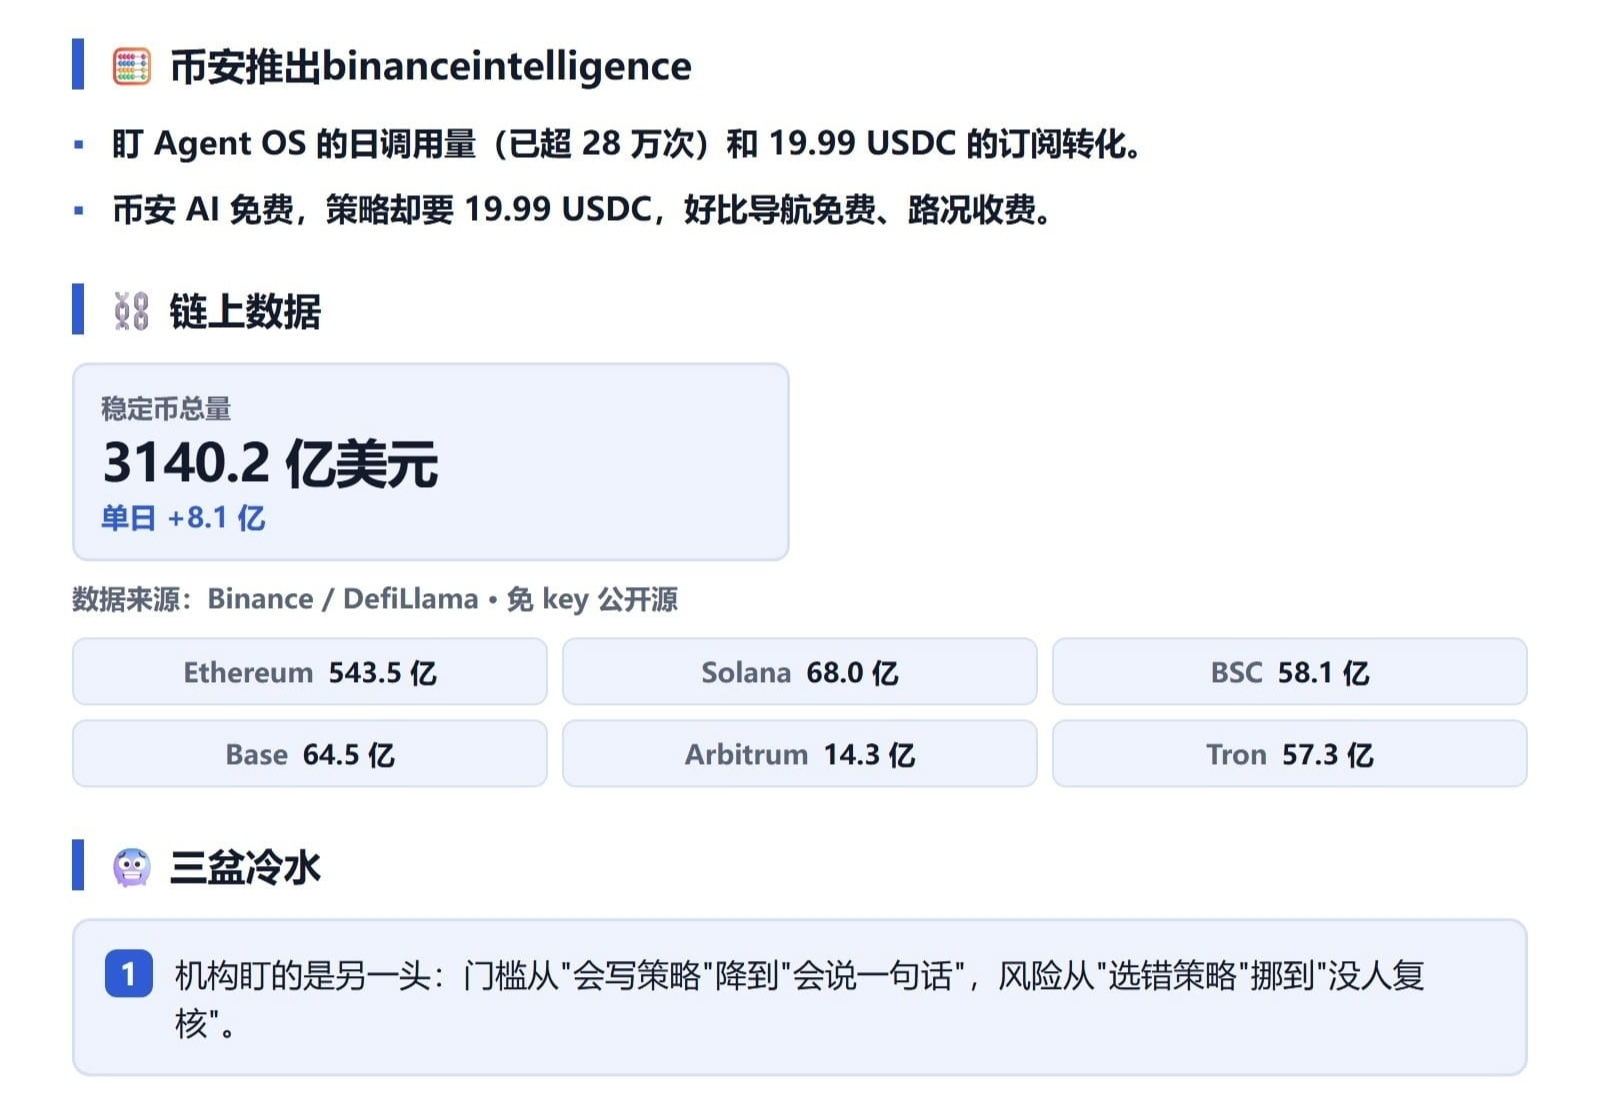
$BNB Binance AI is free, while an AI Pro strategy subscription costs 19.99 USDC—like navigation being free but traffic updates costing extra.
The free version brings together market data, news, and on-chain data. The paid version can turn natural-language instructions into trading strategies, which are isolated in separate sub-accounts; orders require manual review.
The product lowers the barrier to creating strategies from writing code to giving a one-line instruction, but the risk shifts accordingly: it’s no longer about choosing the wrong strategy, but about reviews becoming a formality. Agent OS handles over 280,000 calls a day. The more subscribers there are, the easier it is for the confirmation button to become a mere formality.
The free version brings together market data, news, and on-chain data. The paid version can turn natural-language instructions into trading strategies, which are isolated in separate sub-accounts; orders require manual review.
The product lowers the barrier to creating strategies from writing code to giving a one-line instruction, but the risk shifts accordingly: it’s no longer about choosing the wrong strategy, but about reviews becoming a formality. Agent OS handles over 280,000 calls a day. The more subscribers there are, the easier it is for the confirmation button to become a mere formality.

橙子Joyce
·
--
BullishSpaceX plans to raise $40 billion to pour into Nvidia! The AI computing arms race is heating up again 🚀💥
Following its $25 billion bond issuance in June this year, Elon Musk’s SpaceX is making another aggressive push to raise capital. The company plans to raise $40 billion—including $30 billion in investment-grade bonds and $10 billion in bank loans—specifically to make large-scale purchases of Nvidia chips and accelerate its plans for space and AI data centers!
📌 Key points at a glance:
1️⃣ Fully embracing Nvidia’s Vera Rubin architecture
Musk stated unequivocally during an earnings call that SpaceX has decided to build its computing infrastructure entirely on the Nvidia platform. He also said that Vera Rubin is currently the world’s leading AI computing platform, and that the two companies will work closely together on multiple fronts.
2️⃣ Wall Street giant Apollo to lead $40 billion debt financing
The financing will be led by private equity giant Apollo Global Management and distributed to institutional investors. Bond giant Pimco is also among the lenders in discussions, and the deal is expected to close in 2027.
3️⃣ Hidden concerns in the credit market
Although SpaceX has a BBB investment-grade rating, its long-term bonds maturing in 2056 have fallen to around 85 cents on the dollar, with yields approaching junk-bond levels, due to the company’s limited financial disclosures to date. Bringing in Apollo is intended to boost confidence among institutional buyers by leveraging its extensive network and reputation.
4️⃣ AI data centers are “devouring” global capital
From Nvidia’s partnership with Apollo, BlackRock, and others to build a $500 billion financing platform, to the surge in traditional non-institutional private credit, the massive funding needs of AI computing infrastructure are rapidly draining market liquidity.
————————————————————————
💬 With Starlink in space on one hand and enormous computing power on the other, Musk has taken the AI arms race from the ground into space! We remain optimistic about the long-term capital gains from this wave of AI infrastructure investment, and continue investing in SpaceX and Nvidia (NVDA) stocks on Binance Exchange.
#加密货币 #币安推出BinanceIntelligence We’re building BNB for the long term
#币安交易所美股投资
#SpaceX AI Infrastructure
#NVDA
$NVDA.US
$SPCX.US
$AMZN.US
Following its $25 billion bond issuance in June this year, Elon Musk’s SpaceX is making another aggressive push to raise capital. The company plans to raise $40 billion—including $30 billion in investment-grade bonds and $10 billion in bank loans—specifically to make large-scale purchases of Nvidia chips and accelerate its plans for space and AI data centers!
📌 Key points at a glance:
1️⃣ Fully embracing Nvidia’s Vera Rubin architecture
Musk stated unequivocally during an earnings call that SpaceX has decided to build its computing infrastructure entirely on the Nvidia platform. He also said that Vera Rubin is currently the world’s leading AI computing platform, and that the two companies will work closely together on multiple fronts.
2️⃣ Wall Street giant Apollo to lead $40 billion debt financing
The financing will be led by private equity giant Apollo Global Management and distributed to institutional investors. Bond giant Pimco is also among the lenders in discussions, and the deal is expected to close in 2027.
3️⃣ Hidden concerns in the credit market
Although SpaceX has a BBB investment-grade rating, its long-term bonds maturing in 2056 have fallen to around 85 cents on the dollar, with yields approaching junk-bond levels, due to the company’s limited financial disclosures to date. Bringing in Apollo is intended to boost confidence among institutional buyers by leveraging its extensive network and reputation.
4️⃣ AI data centers are “devouring” global capital
From Nvidia’s partnership with Apollo, BlackRock, and others to build a $500 billion financing platform, to the surge in traditional non-institutional private credit, the massive funding needs of AI computing infrastructure are rapidly draining market liquidity.
————————————————————————
💬 With Starlink in space on one hand and enormous computing power on the other, Musk has taken the AI arms race from the ground into space! We remain optimistic about the long-term capital gains from this wave of AI infrastructure investment, and continue investing in SpaceX and Nvidia (NVDA) stocks on Binance Exchange.
#加密货币 #币安推出BinanceIntelligence We’re building BNB for the long term
#币安交易所美股投资
#SpaceX AI Infrastructure
#NVDA
$NVDA.US
$SPCX.US
$AMZN.US

53
Come, come, come!
Come, come, come!
@奋斗Hustle1688
is speaking[LIVE] 🎙️ Dollar-Cost Averaging into BNB and Chatting About Binance AI
852 listens
116

CJ_GraceWang1688
·
--
🧧🧧🧧
$BTC $BNB
“Buy the dip”#币安推出BinanceIntelligence
$BTC $BNB
“Buy the dip”#币安推出BinanceIntelligence
387
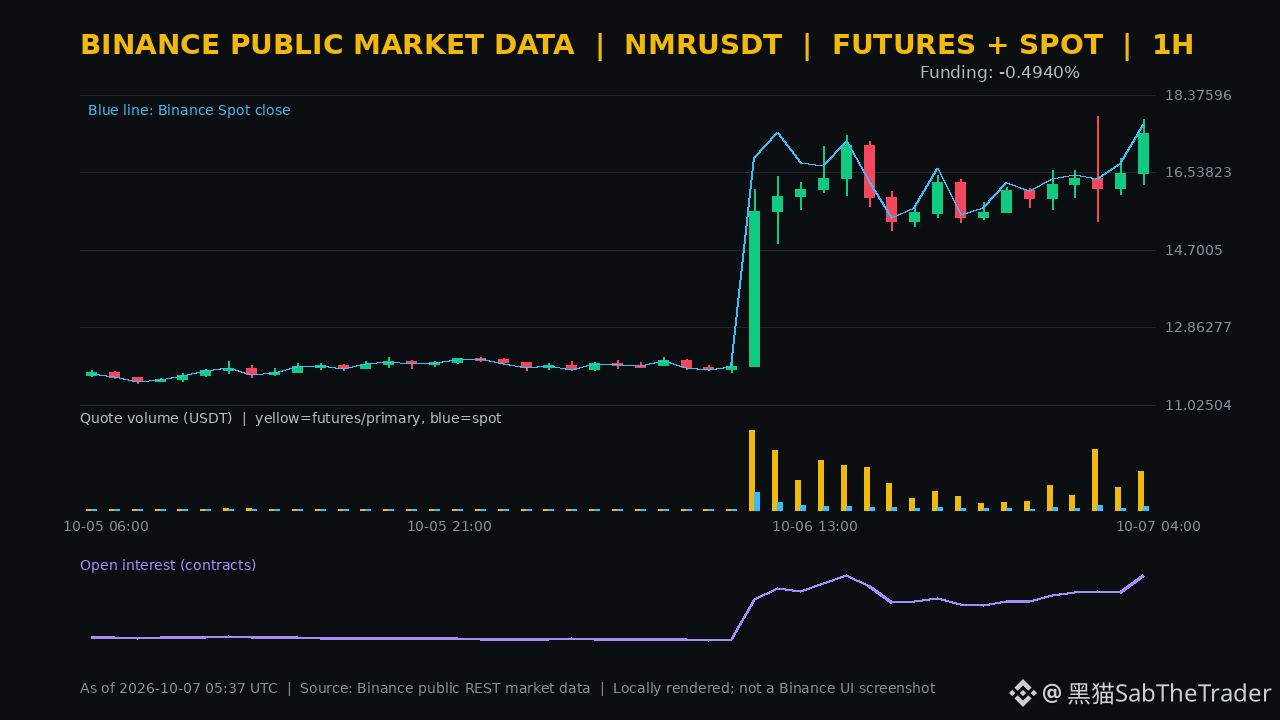
With a similar roughly 44% gain over 24 hours, market focus has shifted to profit-taking at elevated levels after the acceleration. Public Binance data at 13:36 (UTC+8) showed $NMR spot at 17.23 USDT, up 43.94%, and perpetuals at 17.134, up 43.57%; trading volumes were about 41.37 million and 358 million USDT, respectively.
In the last completed 1-hour period, spot rose 5.62%, with volume up 100.78% from the previous hour; perpetuals rose 5.86%, with volume at about 23.76 million USDT, up 74.94%. Over the last four completed hours, perpetuals gained 7.55%, while volume increased 193.50% compared with the previous four hours, clearly indicating accelerating price and volume.
👀 The current, unclosed hourly candle has already pulled back 1.95% from the previous close. OI by quantity rose 14.41% in the last hour and 90.39% over the 30-point window. The indicated Funding rate is -0.4940%, while the latest actual settlement was -0.4367%. Deeply negative funding and rapidly rising OI can amplify a short squeeze, but can also intensify a reverse deleveraging move if the rally fails. OI alone cannot determine the net long/short positioning.
I’m using the previous completed hour’s 16.259–17.799 range as the confirmation zone. A move back above 17.799 in a subsequent completed hourly candle would support another attempt higher—but only if spot volume and OI do not accelerate excessively. A break below 16.259 accompanied by contracting OI would make it more likely that this hourly acceleration is shifting into deleveraging. The current candle has not closed, so I’m not treating the intraday pullback as confirmation of a reversal.
With a similar roughly 44% gain over 24 hours, market focus has shifted to profit-taking at elevated levels after the acceleration. Public Binance data at 13:36 (UTC+8) showed $NMR spot at 17.23 USDT, up 43.94%, and perpetuals at 17.134, up 43.57%; trading volumes were about 41.37 million and 358 million USDT, respectively.
In the last completed 1-hour period, spot rose 5.62%, with volume up 100.78% from the previous hour; perpetuals rose 5.86%, with volume at about 23.76 million USDT, up 74.94%. Over the last four completed hours, perpetuals gained 7.55%, while volume increased 193.50% compared with the previous four hours, clearly indicating accelerating price and volume.
👀 The current, unclosed hourly candle has already pulled back 1.95% from the previous close. OI by quantity rose 14.41% in the last hour and 90.39% over the 30-point window. The indicated Funding rate is -0.4940%, while the latest actual settlement was -0.4367%. Deeply negative funding and rapidly rising OI can amplify a short squeeze, but can also intensify a reverse deleveraging move if the rally fails. OI alone cannot determine the net long/short positioning.
I’m using the previous completed hour’s 16.259–17.799 range as the confirmation zone. A move back above 17.799 in a subsequent completed hourly candle would support another attempt higher—but only if spot volume and OI do not accelerate excessively. A break below 16.259 accompanied by contracting OI would make it more likely that this hourly acceleration is shifting into deleveraging. The current candle has not closed, so I’m not treating the intraday pullback as confirmation of a reversal.
In the last completed 1-hour period, spot rose 5.62%, with volume up 100.78% from the previous hour; perpetuals rose 5.86%, with volume at about 23.76 million USDT, up 74.94%. Over the last four completed hours, perpetuals gained 7.55%, while volume increased 193.50% compared with the previous four hours, clearly indicating accelerating price and volume.
👀 The current, unclosed hourly candle has already pulled back 1.95% from the previous close. OI by quantity rose 14.41% in the last hour and 90.39% over the 30-point window. The indicated Funding rate is -0.4940%, while the latest actual settlement was -0.4367%. Deeply negative funding and rapidly rising OI can amplify a short squeeze, but can also intensify a reverse deleveraging move if the rally fails. OI alone cannot determine the net long/short positioning.
I’m using the previous completed hour’s 16.259–17.799 range as the confirmation zone. A move back above 17.799 in a subsequent completed hourly candle would support another attempt higher—but only if spot volume and OI do not accelerate excessively. A break below 16.259 accompanied by contracting OI would make it more likely that this hourly acceleration is shifting into deleveraging. The current candle has not closed, so I’m not treating the intraday pullback as confirmation of a reversal.
243
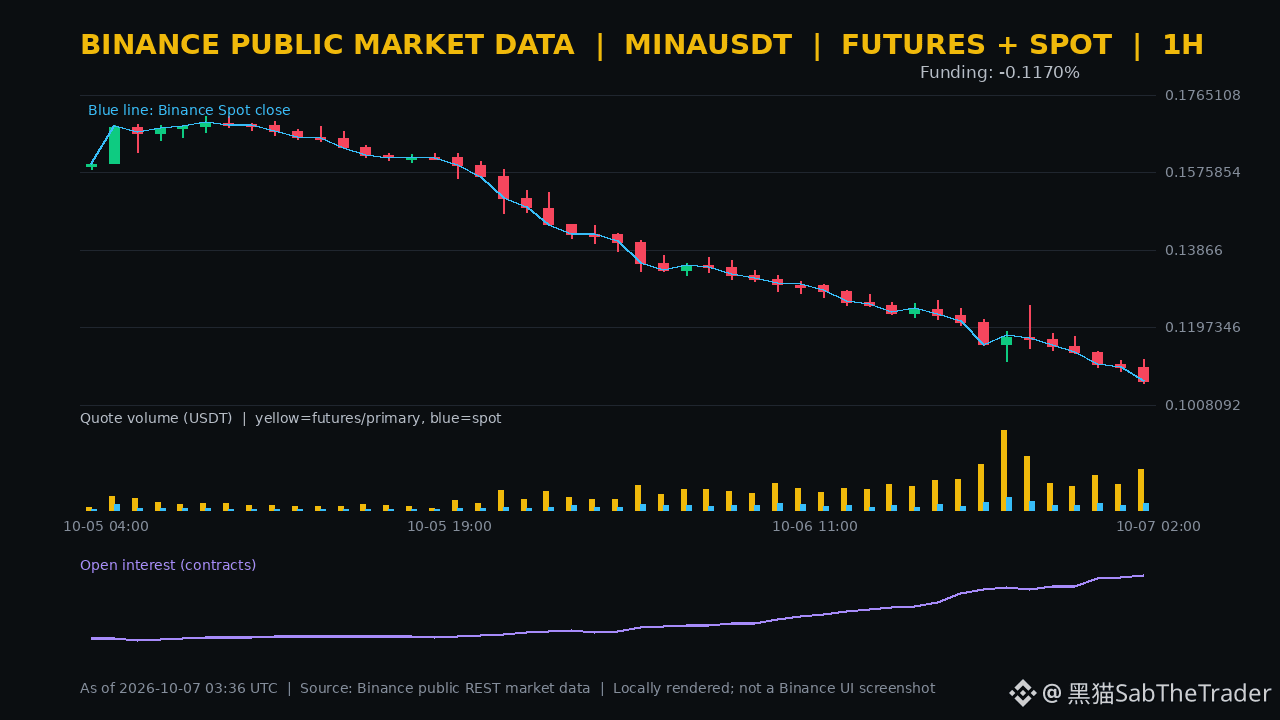
During a roughly 24% decline, price and positioning have not cooled at the same time. Public Binance data at 11:36 (UTC+8) showed $MINA spot at 0.1071, down 23.94%, and perpetuals at 0.10684, down 24.13%; trading volumes were approximately 12.91 million and 72.39 million USDT, respectively.
In the previous completed 1-hour period, spot fell 3.35% as trading volume rose 32.16% from the prior hour; perpetuals fell 3.14%, with trading volume at approximately 4.269 million USDT, up 57.04%. Quantity OI rose 1.89% over the most recent hour and 81.19% over the 30-point window, indicating that leveraged positions continued to accumulate as prices broke lower.
📌 The indicative funding rate is -0.1170%, while the most recent settled rate was -0.1668%. Negative funding and expanding OI alone do not confirm a rebound; instead, they increase the potential for both further declines and short covering. Perpetuals fell another 7.49% over the most recent 4 hours, but trading volume was 39.84% lower than in the preceding 4 hours, so downside momentum did not continue to intensify in tandem.
The current, still-open hourly candle has rebounded just 0.28% from the previous close, so it should not yet be treated as a bottom. Structural recovery would require a subsequent completed hourly candle to reclaim 0.11180, alongside improvement in both spot volume and OI. If price breaks below 0.10603 while OI continues to expand, deleveraging risk remains unresolved.
During a roughly 24% decline, price and positioning have not cooled at the same time. Public Binance data at 11:36 (UTC+8) showed $MINA spot at 0.1071, down 23.94%, and perpetuals at 0.10684, down 24.13%; trading volumes were approximately 12.91 million and 72.39 million USDT, respectively.
In the previous completed 1-hour period, spot fell 3.35% as trading volume rose 32.16% from the prior hour; perpetuals fell 3.14%, with trading volume at approximately 4.269 million USDT, up 57.04%. Quantity OI rose 1.89% over the most recent hour and 81.19% over the 30-point window, indicating that leveraged positions continued to accumulate as prices broke lower.
📌 The indicative funding rate is -0.1170%, while the most recent settled rate was -0.1668%. Negative funding and expanding OI alone do not confirm a rebound; instead, they increase the potential for both further declines and short covering. Perpetuals fell another 7.49% over the most recent 4 hours, but trading volume was 39.84% lower than in the preceding 4 hours, so downside momentum did not continue to intensify in tandem.
The current, still-open hourly candle has rebounded just 0.28% from the previous close, so it should not yet be treated as a bottom. Structural recovery would require a subsequent completed hourly candle to reclaim 0.11180, alongside improvement in both spot volume and OI. If price breaks below 0.10603 while OI continues to expand, deleveraging risk remains unresolved.
In the previous completed 1-hour period, spot fell 3.35% as trading volume rose 32.16% from the prior hour; perpetuals fell 3.14%, with trading volume at approximately 4.269 million USDT, up 57.04%. Quantity OI rose 1.89% over the most recent hour and 81.19% over the 30-point window, indicating that leveraged positions continued to accumulate as prices broke lower.
📌 The indicative funding rate is -0.1170%, while the most recent settled rate was -0.1668%. Negative funding and expanding OI alone do not confirm a rebound; instead, they increase the potential for both further declines and short covering. Perpetuals fell another 7.49% over the most recent 4 hours, but trading volume was 39.84% lower than in the preceding 4 hours, so downside momentum did not continue to intensify in tandem.
The current, still-open hourly candle has rebounded just 0.28% from the previous close, so it should not yet be treated as a bottom. Structural recovery would require a subsequent completed hourly candle to reclaim 0.11180, alongside improvement in both spot volume and OI. If price breaks below 0.10603 while OI continues to expand, deleveraging risk remains unresolved.
419
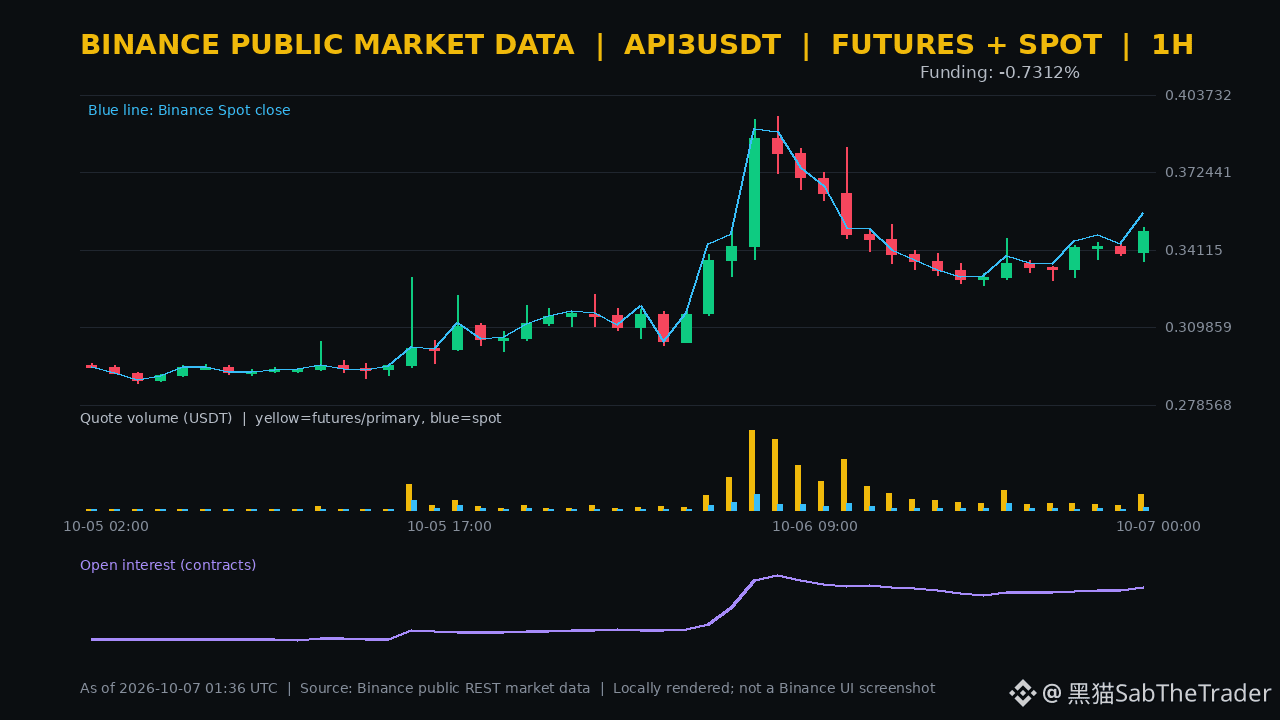
The price gain has not yet reached extreme territory, but positioning is already crowded. Public Binance data at 09:36 (UTC+8) showed that $API3 was up 11.02% over 24 hours on the spot market and 9.39% on perpetuals, with trading volumes of approximately 21.82 million and 136 million USDT, respectively.
In the last fully completed 1-hour period, the perpetual price rose from 0.3400 to 0.3487, a gain of 2.56%. Trading volume was approximately 4.47 million USDT, up 236.34% from the previous period; spot gained 3.76% over the same period, with volume up 142.95%. Open interest by contract quantity increased 3.07% in the past hour and 79.33% over the 30-point window, indicating that new positions are contributing to this short-term rise.
⚠️ The divergence lies in funding. The indicative rate has reached -0.7312%, while the most recent actual settlement was -0.3966%. The current, still-open hourly period is down 1.81% from the previous close. Negative funding alongside a rapid increase in open interest could fuel a further short squeeze, but it could also amplify moves in either direction if the rally fails. Don't chase the trade based on the price gain alone.
For trading, first watch the 0.3365–0.3502 range from the last fully completed hour. If a subsequent full hourly period closes above 0.3502, with spot and perpetual trading volumes and open interest continuing to expand in tandem, the bullish structure can be considered intact. If price falls below 0.3365 while open interest contracts from elevated levels, that would look more like crowded positions beginning to unwind. The current hourly period has not closed, so don't treat an intraperiod bounce or pullback as confirmation.
The price gain has not yet reached extreme territory, but positioning is already crowded. Public Binance data at 09:36 (UTC+8) showed that $API3 was up 11.02% over 24 hours on the spot market and 9.39% on perpetuals, with trading volumes of approximately 21.82 million and 136 million USDT, respectively.
In the last fully completed 1-hour period, the perpetual price rose from 0.3400 to 0.3487, a gain of 2.56%. Trading volume was approximately 4.47 million USDT, up 236.34% from the previous period; spot gained 3.76% over the same period, with volume up 142.95%. Open interest by contract quantity increased 3.07% in the past hour and 79.33% over the 30-point window, indicating that new positions are contributing to this short-term rise.
⚠️ The divergence lies in funding. The indicative rate has reached -0.7312%, while the most recent actual settlement was -0.3966%. The current, still-open hourly period is down 1.81% from the previous close. Negative funding alongside a rapid increase in open interest could fuel a further short squeeze, but it could also amplify moves in either direction if the rally fails. Don't chase the trade based on the price gain alone.
For trading, first watch the 0.3365–0.3502 range from the last fully completed hour. If a subsequent full hourly period closes above 0.3502, with spot and perpetual trading volumes and open interest continuing to expand in tandem, the bullish structure can be considered intact. If price falls below 0.3365 while open interest contracts from elevated levels, that would look more like crowded positions beginning to unwind. The current hourly period has not closed, so don't treat an intraperiod bounce or pullback as confirmation.
In the last fully completed 1-hour period, the perpetual price rose from 0.3400 to 0.3487, a gain of 2.56%. Trading volume was approximately 4.47 million USDT, up 236.34% from the previous period; spot gained 3.76% over the same period, with volume up 142.95%. Open interest by contract quantity increased 3.07% in the past hour and 79.33% over the 30-point window, indicating that new positions are contributing to this short-term rise.
⚠️ The divergence lies in funding. The indicative rate has reached -0.7312%, while the most recent actual settlement was -0.3966%. The current, still-open hourly period is down 1.81% from the previous close. Negative funding alongside a rapid increase in open interest could fuel a further short squeeze, but it could also amplify moves in either direction if the rally fails. Don't chase the trade based on the price gain alone.
For trading, first watch the 0.3365–0.3502 range from the last fully completed hour. If a subsequent full hourly period closes above 0.3502, with spot and perpetual trading volumes and open interest continuing to expand in tandem, the bullish structure can be considered intact. If price falls below 0.3365 while open interest contracts from elevated levels, that would look more like crowded positions beginning to unwind. The current hourly period has not closed, so don't treat an intraperiod bounce or pullback as confirmation.
361
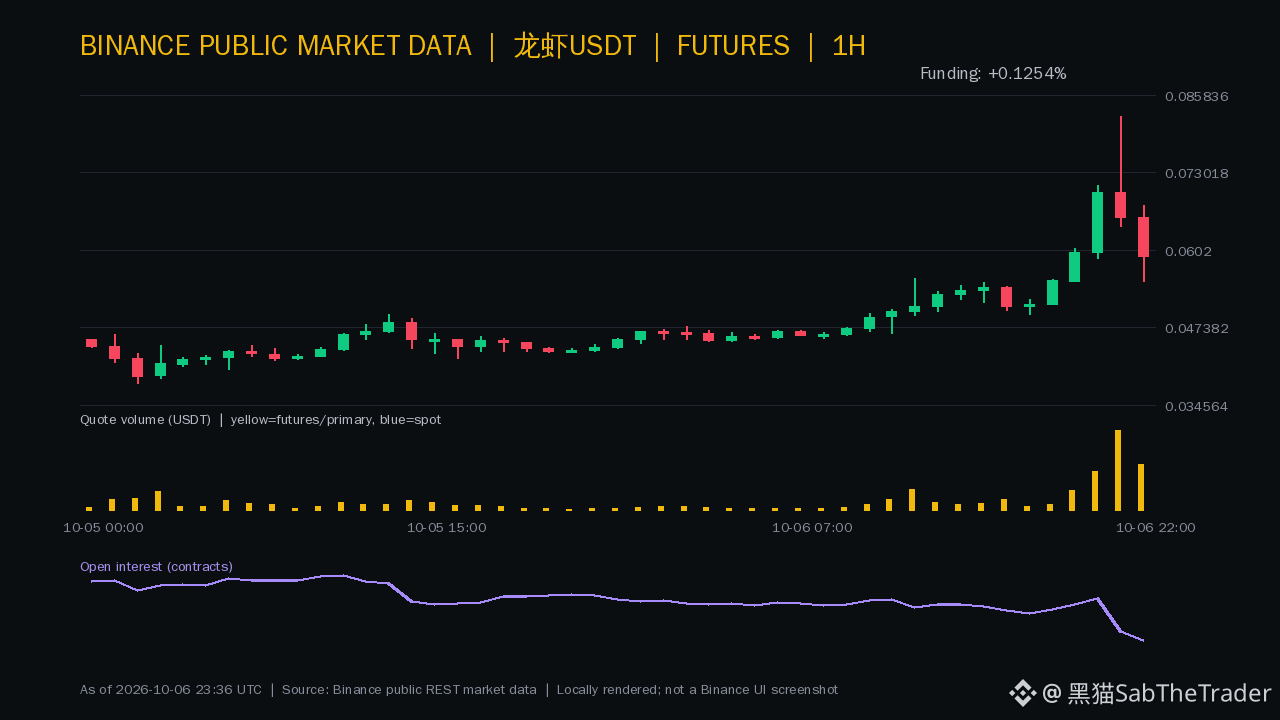
The 24-hour gain is still above 44%, but the market has shifted from an accelerating rally to intense turnover. Public Binance data at 07:36 (UTC+8) showed $Lobster perpetuals at 0.06373, up 44.55% over 24 hours, with roughly 211 million USDT in trading volume; there is no Binance spot market for this asset to use for cross-checking.
The previous full 1-hour candle fell from 0.06550 to 0.05915, a 9.69% pullback, on roughly 31.91 million USDT in volume, down 43.42% from the prior hour. The current, still-open hourly candle has rebounded 7.74% from the previous close. The latest four full hours are still up 7.41%, with volume up 588.76% compared with the preceding four hours. This points to high trading activity, but swings are also getting wider.
⚠️ Open interest by contract quantity fell 1.40% over the past hour and 6.14% over the 30-point window. The funding indicator rose to +0.1254%, while the latest actual settlement was +0.0930%. Elevated prices, shrinking leverage, and a high positive funding rate are occurring together, so chasing the rally carries the risk of a sharp pullback if longs become overcrowded.
For trading purposes, treat 0.05493–0.06757, the range of the previous full hourly candle, as the confirmation zone. A close above 0.06757 on a subsequent full hourly candle, without a marked decline in volume, would support another test of the highs. A break below 0.05493 alongside continued OI contraction would look more like deleveraging after a failed rebound. The current hourly candle has not closed, so do not treat an intraday rally as confirmation.
The 24-hour gain is still above 44%, but the market has shifted from an accelerating rally to intense turnover. Public Binance data at 07:36 (UTC+8) showed $Lobster perpetuals at 0.06373, up 44.55% over 24 hours, with roughly 211 million USDT in trading volume; there is no Binance spot market for this asset to use for cross-checking.
The previous full 1-hour candle fell from 0.06550 to 0.05915, a 9.69% pullback, on roughly 31.91 million USDT in volume, down 43.42% from the prior hour. The current, still-open hourly candle has rebounded 7.74% from the previous close. The latest four full hours are still up 7.41%, with volume up 588.76% compared with the preceding four hours. This points to high trading activity, but swings are also getting wider.
⚠️ Open interest by contract quantity fell 1.40% over the past hour and 6.14% over the 30-point window. The funding indicator rose to +0.1254%, while the latest actual settlement was +0.0930%. Elevated prices, shrinking leverage, and a high positive funding rate are occurring together, so chasing the rally carries the risk of a sharp pullback if longs become overcrowded.
For trading purposes, treat 0.05493–0.06757, the range of the previous full hourly candle, as the confirmation zone. A close above 0.06757 on a subsequent full hourly candle, without a marked decline in volume, would support another test of the highs. A break below 0.05493 alongside continued OI contraction would look more like deleveraging after a failed rebound. The current hourly candle has not closed, so do not treat an intraday rally as confirmation.
The previous full 1-hour candle fell from 0.06550 to 0.05915, a 9.69% pullback, on roughly 31.91 million USDT in volume, down 43.42% from the prior hour. The current, still-open hourly candle has rebounded 7.74% from the previous close. The latest four full hours are still up 7.41%, with volume up 588.76% compared with the preceding four hours. This points to high trading activity, but swings are also getting wider.
⚠️ Open interest by contract quantity fell 1.40% over the past hour and 6.14% over the 30-point window. The funding indicator rose to +0.1254%, while the latest actual settlement was +0.0930%. Elevated prices, shrinking leverage, and a high positive funding rate are occurring together, so chasing the rally carries the risk of a sharp pullback if longs become overcrowded.
For trading purposes, treat 0.05493–0.06757, the range of the previous full hourly candle, as the confirmation zone. A close above 0.06757 on a subsequent full hourly candle, without a marked decline in volume, would support another test of the highs. A break below 0.05493 alongside continued OI contraction would look more like deleveraging after a failed rebound. The current hourly candle has not closed, so do not treat an intraday rally as confirmation.
1
1.1k
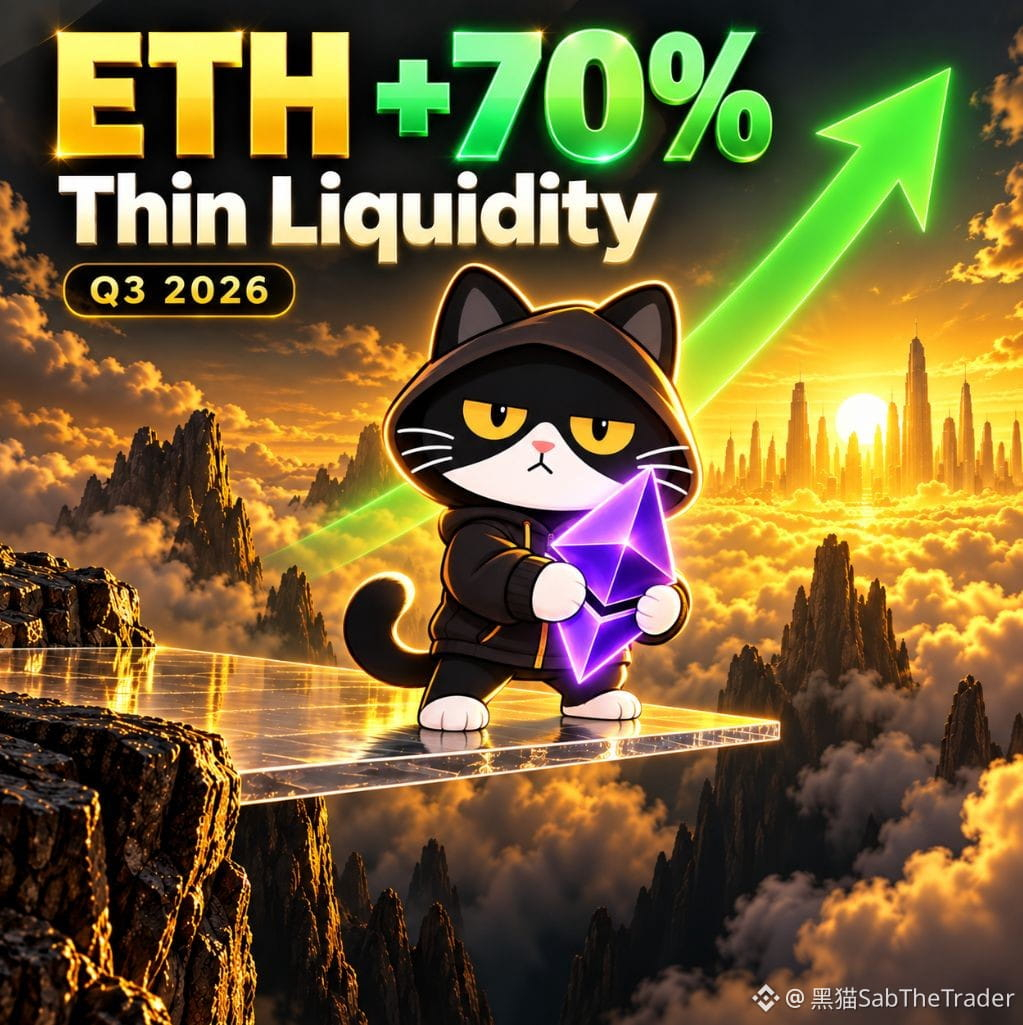
ETH rose about 70% in the third quarter, but buy and sell orders have thinned out. 👀
According to CoinGecko data, $ETH order book depth has fallen to around 35%–45% of $BTC . With fewer orders on the books, the same-sized trade could cause a bigger price swing—pushing prices up quickly, but potentially sending them tumbling even faster.
A strong rally is great, but it’s also worth watching whether buyers step in during a pullback. I’ll wait for ETH to move out of its current consolidation range and try to resist the urge to chase the rally.
{future}(ETHUSDT)
#以太坊q3涨70%流动性下降
ETH rose about 70% in the third quarter, but buy and sell orders have thinned out. 👀
According to CoinGecko data, $ETH order book depth has fallen to around 35%–45% of $BTC . With fewer orders on the books, the same-sized trade could cause a bigger price swing—pushing prices up quickly, but potentially sending them tumbling even faster.
A strong rally is great, but it’s also worth watching whether buyers step in during a pullback. I’ll wait for ETH to move out of its current consolidation range and try to resist the urge to chase the rally.
#以太坊q3涨70%流动性下降
According to CoinGecko data, $ETH order book depth has fallen to around 35%–45% of $BTC . With fewer orders on the books, the same-sized trade could cause a bigger price swing—pushing prices up quickly, but potentially sending them tumbling even faster.
A strong rally is great, but it’s also worth watching whether buyers step in during a pullback. I’ll wait for ETH to move out of its current consolidation range and try to resist the urge to chase the rally.
#以太坊q3涨70%流动性下降
1.1k
21
79
1.1k
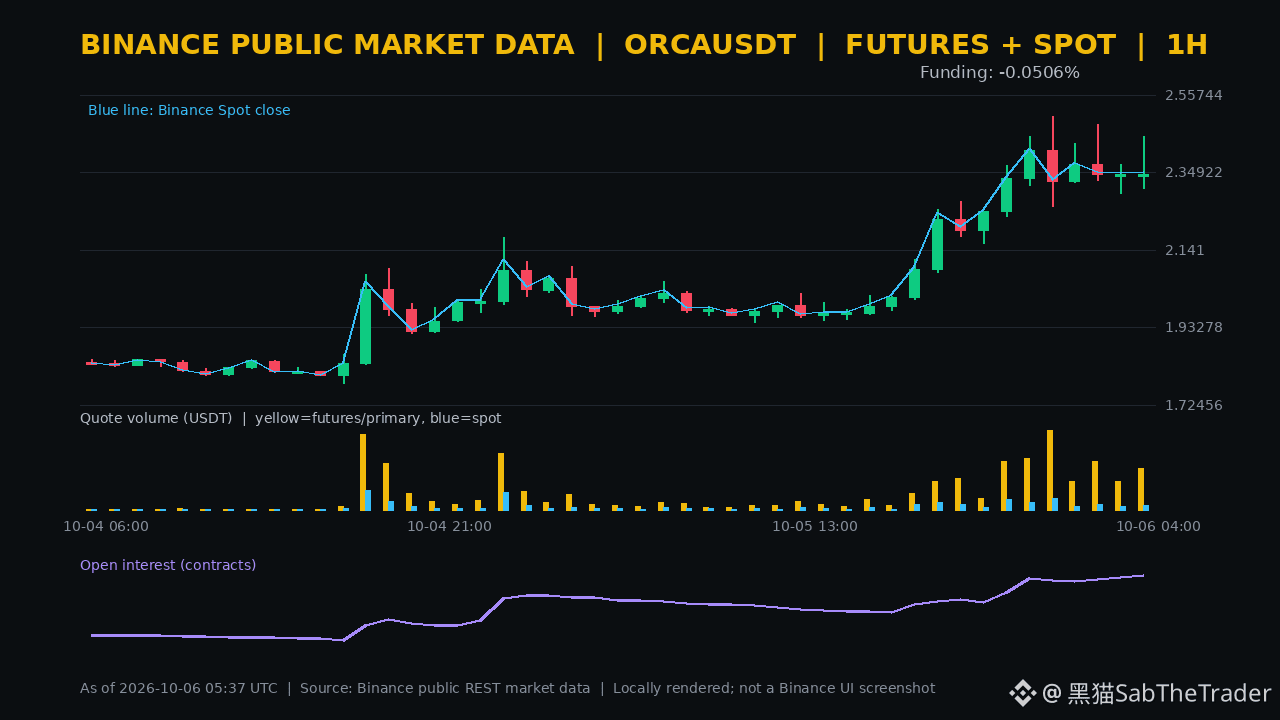
After the increase expanded to around 25%, the market did not continue trending higher in a one-way move; instead, it switched from a complete hourly range to renewed acceleration in the current hour. Binance public data at 13:37 (UTC+8) showed spot at 2.489 for $ORCA , up 24.89% over 24 hours; perpetuals at 2.482, up 25.04%, with 24-hour trading volume of about 86.47 million USDT.
The previous completed 1-hour perpetual candle rose only 0.04%, but trading volume was about 6.829 million USDT, up 44.46% month over month; spot price was flat over the same period, while volume increased 46.39% month over month. The current unclosed hourly perpetual price is 5.84% higher than the previous hour's close, but this intraday acceleration still needs the close to confirm.
Open interest increased 1.46% in the most recent hour and 35.32% over a 30-point window. Funding is indicated at -0.0506%, and the most recent actual settlement was -0.0557%. Negative funding and position expansion can amplify a squeeze, but perpetual trading volume over the last 4 hours fell 22.75% versus the prior 4 hours, so volume has not fully matched price. Do not chase the rally based only on the funding rate.
For short-term observation, the previous completed hourly range was 2.305-2.446. If subsequent completed hours can hold above 2.446 and trading plus OI continue to expand moderately, the strength has a basis to extend; if price falls back below 2.305 and is accompanied by OI contraction, it looks more like deleveraging after a failed acceleration, so first control the risk of chasing price.
After the increase expanded to around 25%, the market did not continue trending higher in a one-way move; instead, it switched from a complete hourly range to renewed acceleration in the current hour. Binance public data at 13:37 (UTC+8) showed spot at 2.489 for $ORCA , up 24.89% over 24 hours; perpetuals at 2.482, up 25.04%, with 24-hour trading volume of about 86.47 million USDT.
The previous completed 1-hour perpetual candle rose only 0.04%, but trading volume was about 6.829 million USDT, up 44.46% month over month; spot price was flat over the same period, while volume increased 46.39% month over month. The current unclosed hourly perpetual price is 5.84% higher than the previous hour's close, but this intraday acceleration still needs the close to confirm.
Open interest increased 1.46% in the most recent hour and 35.32% over a 30-point window. Funding is indicated at -0.0506%, and the most recent actual settlement was -0.0557%. Negative funding and position expansion can amplify a squeeze, but perpetual trading volume over the last 4 hours fell 22.75% versus the prior 4 hours, so volume has not fully matched price. Do not chase the rally based only on the funding rate.
For short-term observation, the previous completed hourly range was 2.305-2.446. If subsequent completed hours can hold above 2.446 and trading plus OI continue to expand moderately, the strength has a basis to extend; if price falls back below 2.305 and is accompanied by OI contraction, it looks more like deleveraging after a failed acceleration, so first control the risk of chasing price.
The previous completed 1-hour perpetual candle rose only 0.04%, but trading volume was about 6.829 million USDT, up 44.46% month over month; spot price was flat over the same period, while volume increased 46.39% month over month. The current unclosed hourly perpetual price is 5.84% higher than the previous hour's close, but this intraday acceleration still needs the close to confirm.
Open interest increased 1.46% in the most recent hour and 35.32% over a 30-point window. Funding is indicated at -0.0506%, and the most recent actual settlement was -0.0557%. Negative funding and position expansion can amplify a squeeze, but perpetual trading volume over the last 4 hours fell 22.75% versus the prior 4 hours, so volume has not fully matched price. Do not chase the rally based only on the funding rate.
For short-term observation, the previous completed hourly range was 2.305-2.446. If subsequent completed hours can hold above 2.446 and trading plus OI continue to expand moderately, the strength has a basis to extend; if price falls back below 2.305 and is accompanied by OI contraction, it looks more like deleveraging after a failed acceleration, so first control the risk of chasing price.
375
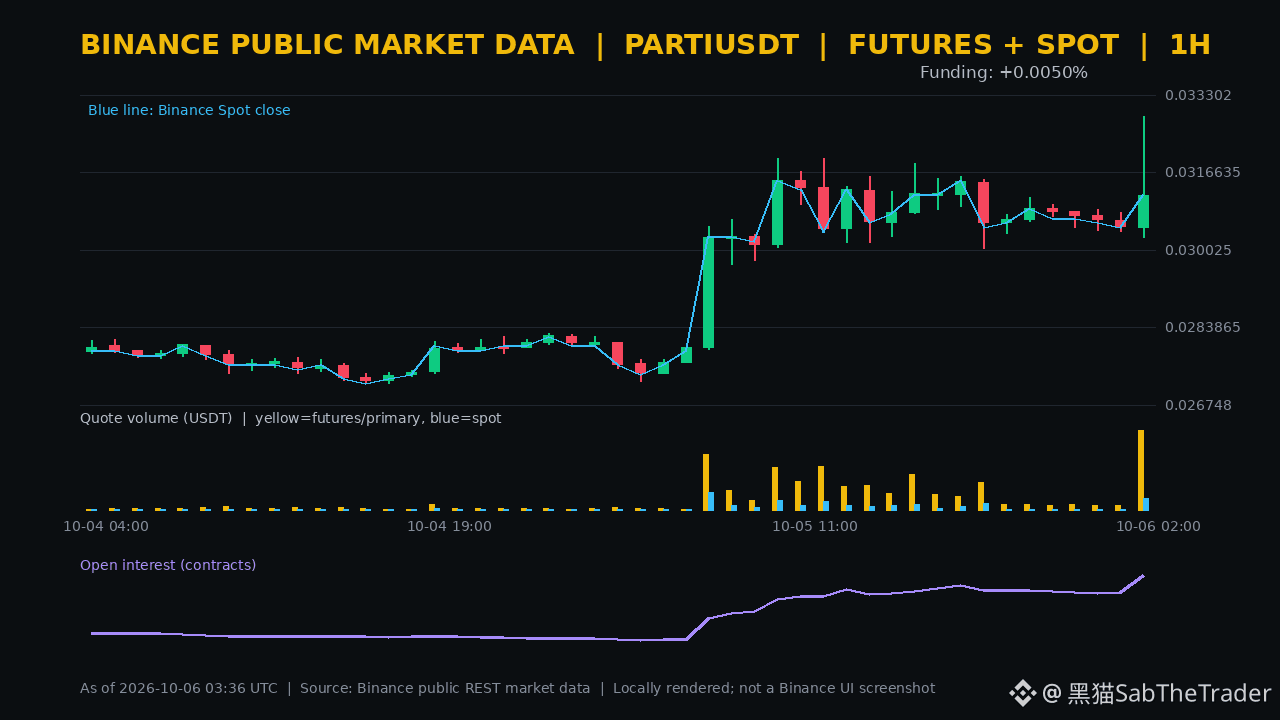
This move is being driven by more than just a 24-hour gain: hourly trading volume and positioning are accelerating in tandem. Public Binance data at 11:37 (UTC+8) showed $PARTI spot at 0.03250, up 17.33% over 24 hours; perpetuals were at 0.03246, up 16.97%, with approximately 29.97 million USDT in 24-hour trading volume.
In the last completed 1-hour period, perpetuals rose 2.16%, with trading volume of approximately 4.515 million USDT, up 1788.79% from the previous hour; spot rose 2.30% over the same period, with trading volume up 2429.50%. The current, unclosed hourly candle has risen about 4.27% above the previous hour’s close, but an intraperiod gain should not be treated as a confirmed close.
OI in contracts increased 11.88% over the last hour and 58.06% over the 30-point window, indicating a clear acceleration in position buildup. Both the Funding indicator and the latest settlement are at +0.0050%, so long funding has not yet reached an extreme. ⚠️ The alignment of price, volume, and OI favors trend continuation, but perpetuals’ 24-hour liquidity is only around 30 million USDT, and rapid position increases can amplify deleveraging in either direction.
In the short term, watch the previous completed hourly range of 0.03029–0.03285. A further move higher is supported only if a subsequent completed hourly candle holds above 0.03285 on increased volume, without OI growth accelerating excessively. If price falls back below 0.03029 while OI remains elevated, prioritize guarding against a rapid pullback following a failed breakout.
This move is being driven by more than just a 24-hour gain: hourly trading volume and positioning are accelerating in tandem. Public Binance data at 11:37 (UTC+8) showed $PARTI spot at 0.03250, up 17.33% over 24 hours; perpetuals were at 0.03246, up 16.97%, with approximately 29.97 million USDT in 24-hour trading volume.
In the last completed 1-hour period, perpetuals rose 2.16%, with trading volume of approximately 4.515 million USDT, up 1788.79% from the previous hour; spot rose 2.30% over the same period, with trading volume up 2429.50%. The current, unclosed hourly candle has risen about 4.27% above the previous hour’s close, but an intraperiod gain should not be treated as a confirmed close.
OI in contracts increased 11.88% over the last hour and 58.06% over the 30-point window, indicating a clear acceleration in position buildup. Both the Funding indicator and the latest settlement are at +0.0050%, so long funding has not yet reached an extreme. ⚠️ The alignment of price, volume, and OI favors trend continuation, but perpetuals’ 24-hour liquidity is only around 30 million USDT, and rapid position increases can amplify deleveraging in either direction.
In the short term, watch the previous completed hourly range of 0.03029–0.03285. A further move higher is supported only if a subsequent completed hourly candle holds above 0.03285 on increased volume, without OI growth accelerating excessively. If price falls back below 0.03029 while OI remains elevated, prioritize guarding against a rapid pullback following a failed breakout.
In the last completed 1-hour period, perpetuals rose 2.16%, with trading volume of approximately 4.515 million USDT, up 1788.79% from the previous hour; spot rose 2.30% over the same period, with trading volume up 2429.50%. The current, unclosed hourly candle has risen about 4.27% above the previous hour’s close, but an intraperiod gain should not be treated as a confirmed close.
OI in contracts increased 11.88% over the last hour and 58.06% over the 30-point window, indicating a clear acceleration in position buildup. Both the Funding indicator and the latest settlement are at +0.0050%, so long funding has not yet reached an extreme. ⚠️ The alignment of price, volume, and OI favors trend continuation, but perpetuals’ 24-hour liquidity is only around 30 million USDT, and rapid position increases can amplify deleveraging in either direction.
In the short term, watch the previous completed hourly range of 0.03029–0.03285. A further move higher is supported only if a subsequent completed hourly candle holds above 0.03285 on increased volume, without OI growth accelerating excessively. If price falls back below 0.03029 while OI remains elevated, prioritize guarding against a rapid pullback following a failed breakout.
284
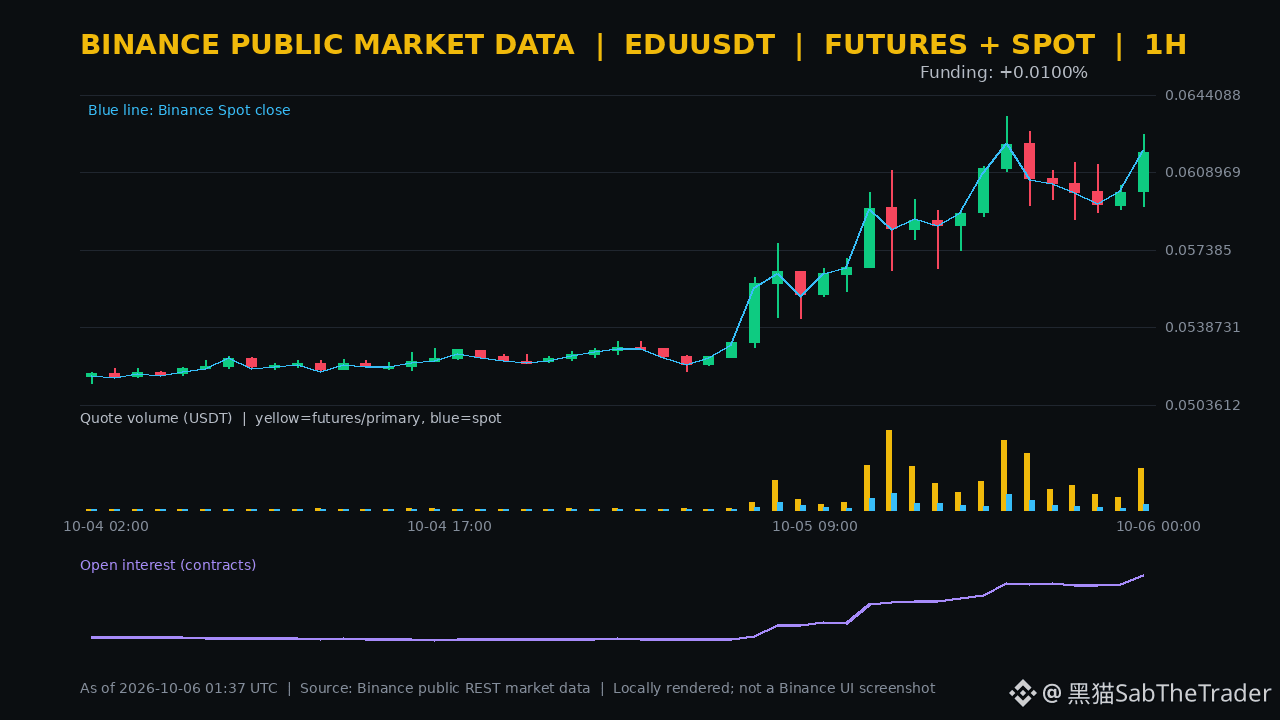
Gains are continuing, but momentum is no longer as smooth as it was earlier. Public Binance data at 09:37 (UTC+8) shows $EDU spot at 0.0613, up 15.66% over 24 hours; perpetuals are at 0.06138, up 15.79%, with 24-hour trading volume of approximately 27.88 million USDT.
Perpetuals rose 2.93% in the previous full one-hour period, with trading volume of approximately 1.88 million USDT, up 226.53% from the prior hour. The current, still-open hourly candle is down 0.66% from the previous hour's close. The price has pulled back after a spike, so an intraday rebound should not be taken as confirmation of a fresh breakout.
Quantity OI increased 3.48% over the past hour and 29.60% over the 30-point window, indicating that positions are still expanding. However, both the Funding indication and the latest settlement are only +0.0100%, so funding rates have not yet reached extreme long levels. ⚠️ At the same time, perpetual trading volume over the past four hours fell 46.34% compared with the preceding four hours. This is the key divergence to watch right now: positions are still increasing, but trading volume is cooling.
In the short term, watch the previous full-hour range of 0.05936–0.06263. If a subsequent full hourly candle breaks above 0.06263 on rising volume, without OI expansion accelerating excessively, the trend may have room to push higher. If price falls below 0.05936 alongside contracting OI, it would look more like positions unwinding at elevated levels, so limit the risk of chasing the rally.
Gains are continuing, but momentum is no longer as smooth as it was earlier. Public Binance data at 09:37 (UTC+8) shows $EDU spot at 0.0613, up 15.66% over 24 hours; perpetuals are at 0.06138, up 15.79%, with 24-hour trading volume of approximately 27.88 million USDT.
Perpetuals rose 2.93% in the previous full one-hour period, with trading volume of approximately 1.88 million USDT, up 226.53% from the prior hour. The current, still-open hourly candle is down 0.66% from the previous hour's close. The price has pulled back after a spike, so an intraday rebound should not be taken as confirmation of a fresh breakout.
Quantity OI increased 3.48% over the past hour and 29.60% over the 30-point window, indicating that positions are still expanding. However, both the Funding indication and the latest settlement are only +0.0100%, so funding rates have not yet reached extreme long levels. ⚠️ At the same time, perpetual trading volume over the past four hours fell 46.34% compared with the preceding four hours. This is the key divergence to watch right now: positions are still increasing, but trading volume is cooling.
In the short term, watch the previous full-hour range of 0.05936–0.06263. If a subsequent full hourly candle breaks above 0.06263 on rising volume, without OI expansion accelerating excessively, the trend may have room to push higher. If price falls below 0.05936 alongside contracting OI, it would look more like positions unwinding at elevated levels, so limit the risk of chasing the rally.
Perpetuals rose 2.93% in the previous full one-hour period, with trading volume of approximately 1.88 million USDT, up 226.53% from the prior hour. The current, still-open hourly candle is down 0.66% from the previous hour's close. The price has pulled back after a spike, so an intraday rebound should not be taken as confirmation of a fresh breakout.
Quantity OI increased 3.48% over the past hour and 29.60% over the 30-point window, indicating that positions are still expanding. However, both the Funding indication and the latest settlement are only +0.0100%, so funding rates have not yet reached extreme long levels. ⚠️ At the same time, perpetual trading volume over the past four hours fell 46.34% compared with the preceding four hours. This is the key divergence to watch right now: positions are still increasing, but trading volume is cooling.
In the short term, watch the previous full-hour range of 0.05936–0.06263. If a subsequent full hourly candle breaks above 0.06263 on rising volume, without OI expansion accelerating excessively, the trend may have room to push higher. If price falls below 0.05936 alongside contracting OI, it would look more like positions unwinding at elevated levels, so limit the risk of chasing the rally.
692
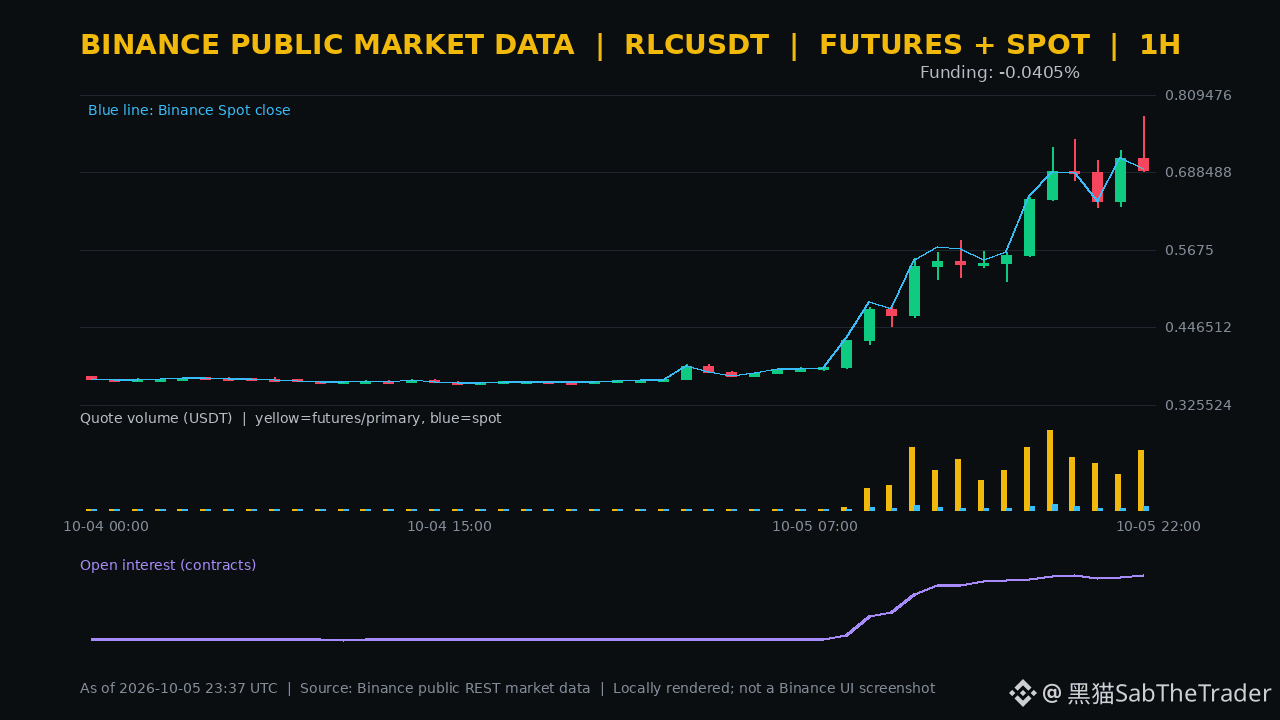
After nearly doubling over 24 hours, RLC is now experiencing intense price swings at elevated levels. Binance public data at 07:37 (UTC+8) shows spot at $RLC , with the spot price at 0.7236, up 99.17% over 24 hours; perpetuals at 0.7201, up 98.81%, with trading volume of about 530 million USDT.
The last full 1-hour perpetual candle fell 2.61%, but volume was about 50.11 million USDT, up 68.63% month over month; the current still-open hour has rebounded 4.12% from the previous hour's close. The price pulled back and quickly recovered, indicating that short-term trading is still very active, but incomplete hourly data cannot be treated as confirmation of a breakout.
Open interest has increased 2.88% in the most recent hour, and surged 416.74% over the 30-point window, meaning position expansion is much faster than short-term price changes. Funding is indicated at -0.0405%, with the most recent actual settlement at -0.0239%. Negative funding does not necessarily mean prices will keep rising; combined with very large open interest at high levels, it may instead amplify squeeze risk on both the long and short sides, as well as deleveraging risk.
For the short term, first watch the last full hourly range of 0.6904—0.7761. If a later full hour closes above 0.7761 on strong volume and OI growth starts to stabilize, then the strength has room to continue; if price breaks below 0.6904 accompanied by a rapid contraction in OI, it looks more like the fading of crowded positions, and the nearly 100% gain should not be extrapolated directly.
After nearly doubling over 24 hours, RLC is now experiencing intense price swings at elevated levels. Binance public data at 07:37 (UTC+8) shows spot at $RLC , with the spot price at 0.7236, up 99.17% over 24 hours; perpetuals at 0.7201, up 98.81%, with trading volume of about 530 million USDT.
The last full 1-hour perpetual candle fell 2.61%, but volume was about 50.11 million USDT, up 68.63% month over month; the current still-open hour has rebounded 4.12% from the previous hour's close. The price pulled back and quickly recovered, indicating that short-term trading is still very active, but incomplete hourly data cannot be treated as confirmation of a breakout.
Open interest has increased 2.88% in the most recent hour, and surged 416.74% over the 30-point window, meaning position expansion is much faster than short-term price changes. Funding is indicated at -0.0405%, with the most recent actual settlement at -0.0239%. Negative funding does not necessarily mean prices will keep rising; combined with very large open interest at high levels, it may instead amplify squeeze risk on both the long and short sides, as well as deleveraging risk.
For the short term, first watch the last full hourly range of 0.6904—0.7761. If a later full hour closes above 0.7761 on strong volume and OI growth starts to stabilize, then the strength has room to continue; if price breaks below 0.6904 accompanied by a rapid contraction in OI, it looks more like the fading of crowded positions, and the nearly 100% gain should not be extrapolated directly.
The last full 1-hour perpetual candle fell 2.61%, but volume was about 50.11 million USDT, up 68.63% month over month; the current still-open hour has rebounded 4.12% from the previous hour's close. The price pulled back and quickly recovered, indicating that short-term trading is still very active, but incomplete hourly data cannot be treated as confirmation of a breakout.
Open interest has increased 2.88% in the most recent hour, and surged 416.74% over the 30-point window, meaning position expansion is much faster than short-term price changes. Funding is indicated at -0.0405%, with the most recent actual settlement at -0.0239%. Negative funding does not necessarily mean prices will keep rising; combined with very large open interest at high levels, it may instead amplify squeeze risk on both the long and short sides, as well as deleveraging risk.
For the short term, first watch the last full hourly range of 0.6904—0.7761. If a later full hour closes above 0.7761 on strong volume and OI growth starts to stabilize, then the strength has room to continue; if price breaks below 0.6904 accompanied by a rapid contraction in OI, it looks more like the fading of crowded positions, and the nearly 100% gain should not be extrapolated directly.
1
969
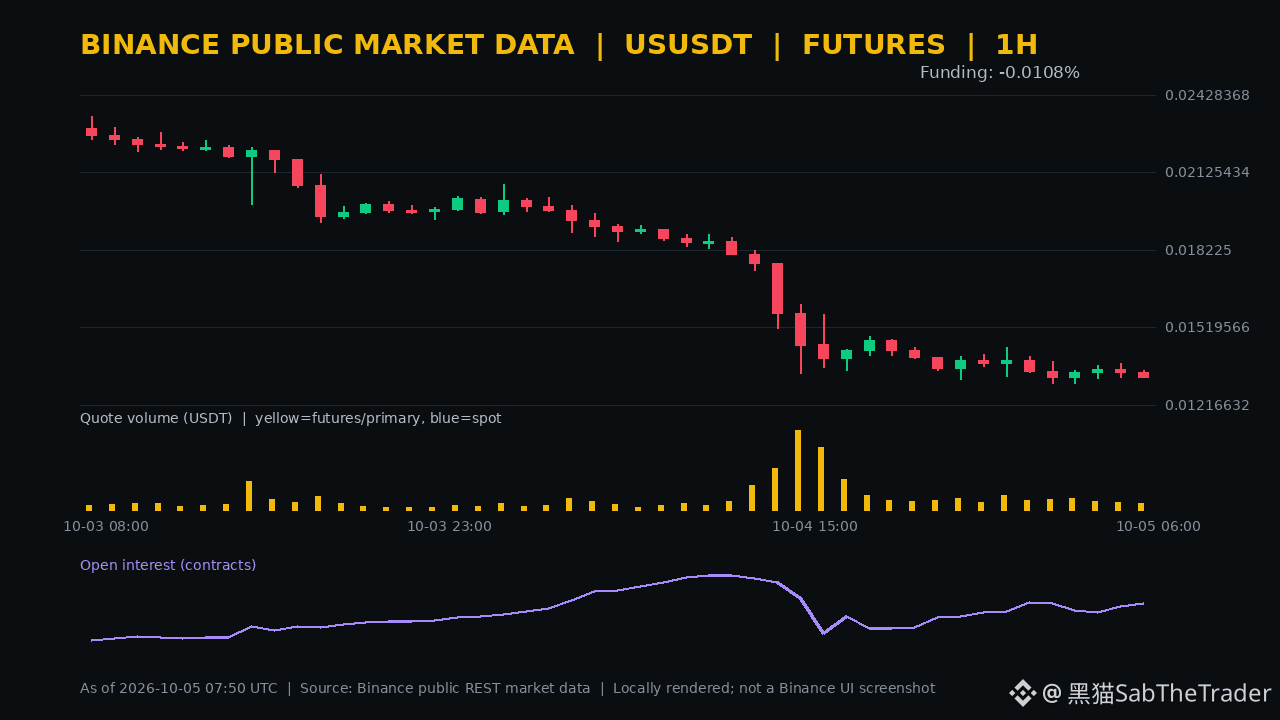
After falling more than 30% in 24 hours, the market has yet to show clear signs of position liquidation. Public Binance data at 15:50 (UTC+8) showed $US perpetual trading at 0.012811, down 32.32% over 24 hours, with about 97.95 million USDT in trading volume; the current, still-open hourly candle is down a further 3.22% from the previous hour’s close.
The previous full hour fell 1.36%, with about 1.5 million USDT in trading volume, down 16.92% from the hour before. Prices were nearly flat over the last four full hours, while trading volume fell 16.51% compared with the preceding four hours. Short-term volume has cooled, but contract-count OI still rose 0.47% over the past hour and 2.38% over the 30-point window, indicating that the number of contracts has not contracted in step with the price decline. This does not reveal the direction of newly opened positions, but it does mean leverage-driven disagreement remains.
The funding indicator is at -0.0108%, while the most recent actual settlement was -0.0031%—negative, but not yet extreme. After a sharp decline, chasing shorts means guarding against both further downside and a rapid rebound in a low-liquidity environment.
In the short term, watch 0.013231–0.013510, the range of the previous full hour. If a subsequent full hourly candle fails to close back above 0.013231 while OI continues to rise, bearish pressure will remain dominant. If the price reclaims 0.013510 and OI falls, that would look more like crowded positions unwinding, making it significantly less attractive to chase shorts.
After falling more than 30% in 24 hours, the market has yet to show clear signs of position liquidation. Public Binance data at 15:50 (UTC+8) showed $US perpetual trading at 0.012811, down 32.32% over 24 hours, with about 97.95 million USDT in trading volume; the current, still-open hourly candle is down a further 3.22% from the previous hour’s close.
The previous full hour fell 1.36%, with about 1.5 million USDT in trading volume, down 16.92% from the hour before. Prices were nearly flat over the last four full hours, while trading volume fell 16.51% compared with the preceding four hours. Short-term volume has cooled, but contract-count OI still rose 0.47% over the past hour and 2.38% over the 30-point window, indicating that the number of contracts has not contracted in step with the price decline. This does not reveal the direction of newly opened positions, but it does mean leverage-driven disagreement remains.
The funding indicator is at -0.0108%, while the most recent actual settlement was -0.0031%—negative, but not yet extreme. After a sharp decline, chasing shorts means guarding against both further downside and a rapid rebound in a low-liquidity environment.
In the short term, watch 0.013231–0.013510, the range of the previous full hour. If a subsequent full hourly candle fails to close back above 0.013231 while OI continues to rise, bearish pressure will remain dominant. If the price reclaims 0.013510 and OI falls, that would look more like crowded positions unwinding, making it significantly less attractive to chase shorts.
The previous full hour fell 1.36%, with about 1.5 million USDT in trading volume, down 16.92% from the hour before. Prices were nearly flat over the last four full hours, while trading volume fell 16.51% compared with the preceding four hours. Short-term volume has cooled, but contract-count OI still rose 0.47% over the past hour and 2.38% over the 30-point window, indicating that the number of contracts has not contracted in step with the price decline. This does not reveal the direction of newly opened positions, but it does mean leverage-driven disagreement remains.
The funding indicator is at -0.0108%, while the most recent actual settlement was -0.0031%—negative, but not yet extreme. After a sharp decline, chasing shorts means guarding against both further downside and a rapid rebound in a low-liquidity environment.
In the short term, watch 0.013231–0.013510, the range of the previous full hour. If a subsequent full hourly candle fails to close back above 0.013231 while OI continues to rise, bearish pressure will remain dominant. If the price reclaims 0.013510 and OI falls, that would look more like crowded positions unwinding, making it significantly less attractive to chase shorts.
1
862
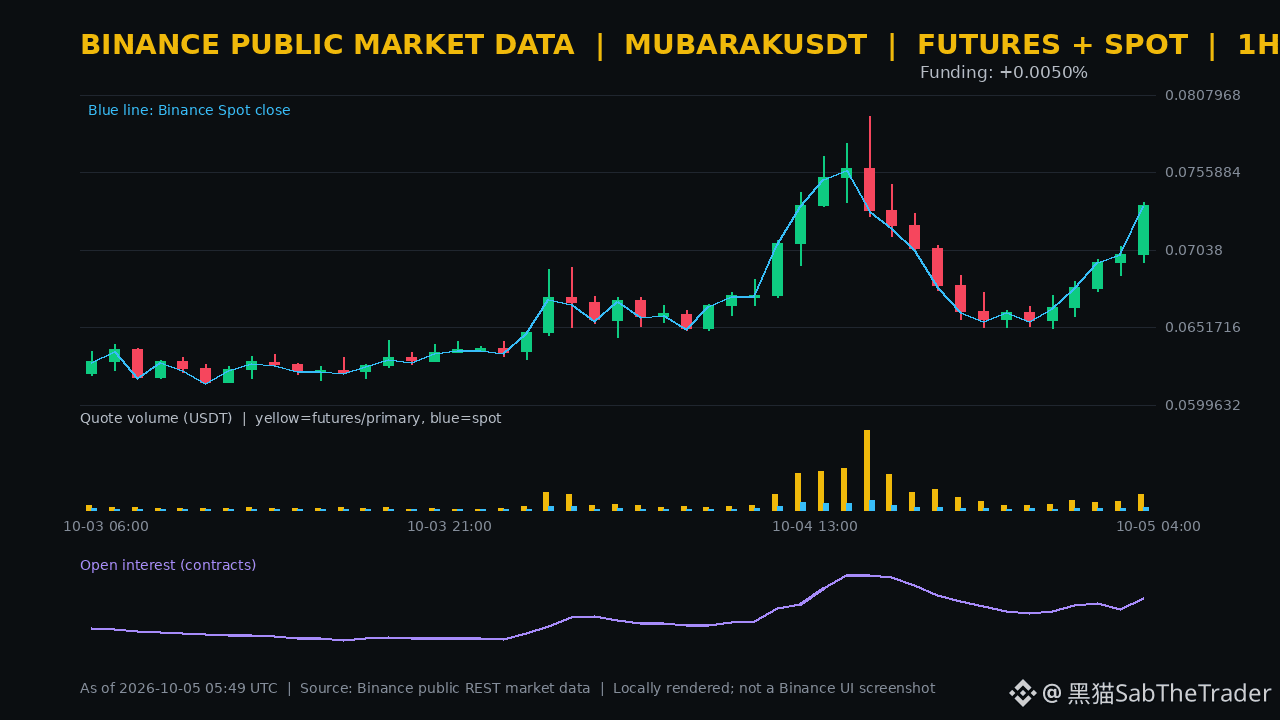
Prices, trading activity, and open positions are all rising in this round at the same time—having more information value than a standalone price increase. According to Binance’s public data at 13:48 (UTC+8), $MUBARAK spot is quoted at 0.07745, up 17.08% over the past 24 hours; the perpetual contract is at 0.07757, up 17.30%, with approximately 148 million USDT in trading volume over the past 24 hours.
In the previous complete hour, spot and perps rose by 4.64% and 4.67%, respectively. Perp trading volume was about 5.34 million USDT, up 83.21% month-over-month; spot trading volume also increased 48.98% month-over-month. Over the most recent four complete hours, perps rose 10.24%, and trading volume increased 69.00% compared with the prior four hours. OI (open interest) increased by 1.62% over one hour, and the 30-point window increased by 6.01%. With quantity, price, and positions moving together, the underlying structure remains intact.
Funding indications and the most recent actual settlement were both +0.0050%, not following the price surge into crowded positive territory. However, OI only indicates that the number of contracts increased; it cannot determine the direction of new positioning. After a quick surge, any weakening in follow-through could still trigger deleveraging.
For the short term, first look at the prior complete hour’s range of 0.06955–0.07357. In the subsequent complete hour, only if it holds above 0.07357 and trading volume and OI continue to expand can the breakout be considered confirmed. If it falls back below 0.06955 and OI declines as well, treat it as a position “tide retreat” after a high, and do not chase the price.
Prices, trading activity, and open positions are all rising in this round at the same time—having more information value than a standalone price increase. According to Binance’s public data at 13:48 (UTC+8), $MUBARAK spot is quoted at 0.07745, up 17.08% over the past 24 hours; the perpetual contract is at 0.07757, up 17.30%, with approximately 148 million USDT in trading volume over the past 24 hours.
In the previous complete hour, spot and perps rose by 4.64% and 4.67%, respectively. Perp trading volume was about 5.34 million USDT, up 83.21% month-over-month; spot trading volume also increased 48.98% month-over-month. Over the most recent four complete hours, perps rose 10.24%, and trading volume increased 69.00% compared with the prior four hours. OI (open interest) increased by 1.62% over one hour, and the 30-point window increased by 6.01%. With quantity, price, and positions moving together, the underlying structure remains intact.
Funding indications and the most recent actual settlement were both +0.0050%, not following the price surge into crowded positive territory. However, OI only indicates that the number of contracts increased; it cannot determine the direction of new positioning. After a quick surge, any weakening in follow-through could still trigger deleveraging.
For the short term, first look at the prior complete hour’s range of 0.06955–0.07357. In the subsequent complete hour, only if it holds above 0.07357 and trading volume and OI continue to expand can the breakout be considered confirmed. If it falls back below 0.06955 and OI declines as well, treat it as a position “tide retreat” after a high, and do not chase the price.
In the previous complete hour, spot and perps rose by 4.64% and 4.67%, respectively. Perp trading volume was about 5.34 million USDT, up 83.21% month-over-month; spot trading volume also increased 48.98% month-over-month. Over the most recent four complete hours, perps rose 10.24%, and trading volume increased 69.00% compared with the prior four hours. OI (open interest) increased by 1.62% over one hour, and the 30-point window increased by 6.01%. With quantity, price, and positions moving together, the underlying structure remains intact.
Funding indications and the most recent actual settlement were both +0.0050%, not following the price surge into crowded positive territory. However, OI only indicates that the number of contracts increased; it cannot determine the direction of new positioning. After a quick surge, any weakening in follow-through could still trigger deleveraging.
For the short term, first look at the prior complete hour’s range of 0.06955–0.07357. In the subsequent complete hour, only if it holds above 0.07357 and trading volume and OI continue to expand can the breakout be considered confirmed. If it falls back below 0.06955 and OI declines as well, treat it as a position “tide retreat” after a high, and do not chase the price.
1
437
Log in to explore more content
Join global crypto users on Binance Square
⚡️ Get latest and useful information about crypto.
💬 Trusted by the world’s largest crypto exchange.
👍 Discover real insights from verified creators.
Email / Phone number
Trending Topics
BinanceLaunchesBinanceIntelligence
734,065 views
4,594 Discussing
#binancelaunchesbinanceintelligence 🚨 WHAT IF THE NEXT BIG EXCHANGE BATTLE ISN’T ABOUT FEES? 👀
Binance just made a bigger move than adding another AI chatbot.
With Binance Intelligence, AI is moving deeper into the exchange — from understanding market data to building trading workflows. 🤖⚡
The real question is:
Who has the best liquidity?
Or who has the smartest AI layer?
If users can research, test ideas and manage trading workflows without switching between different tools, the exchange itself could become a financial assistant.
That could be a much bigger shift than it looks today.
If Binance Intelligence drives more users, more strategies and more trading activity, $BNB could become one of the tokens to watch. 👀
Is Binance building the future of AI-powered finance?
$BNB
#binancelaunchesbinanceintelligence #BinanceAI #CryptoAI #AITrading
Suleman Khan Haqqani
·25 Likes
·26.5k views
BTCFallsBelow$84K
30,176 views
107 Discussing
DubaiVARAIssuesReserveAssetAuditCircular
7,314 views
355 Discussing