ZEC at $1,360—would you chase it?
First, the surface picture: ZEC surged to 1,697 on September 26, then got hammered all the way down to 1,271 on October 3. Today it dipped to 1,280 before bouncing back to 1,360. It’s down 4%–15% over the past 7 days, up 15% over 30 days, and ranks tenth by market cap at $23 billion. Trading volume is up over the past 24 hours, and today’s daily candle has a long lower wick—a bounce off the lows. Every group chat is shouting, “ZEC is back—let’s go!”
But take three seconds to think: from 1,697, it’s already given back 20%. The 1,270–1,370 range is a box, and today’s price has reached the top—not the bottom.
First: the NU7 testnet was brought forward, but the mainnet hasn’t been approved. Don’t celebrate too soon.
On October 4, the NU7 testnet was activated ahead of schedule at block height 4465026. Block times were cut from 75 seconds to 25 seconds, 60% of fees go to the reserve, and the halving schedule remains unchanged.
Testnet = dress rehearsal; mainnet = opening night
Mainnet decision date: October 20
Target activation date: November 5
Second: The ETF channel is there, but the inflows have dried up.
Grayscale’s ZCSH split is complete. The fund previously had about $900 million in assets. Sounds like a lot?
But on Monday, ZEC-related funds saw small net outflows, weakening alongside BTC and ETH.
This isn’t a ZEC-specific blowup—the whole market is bleeding. Spot ETFs saw about $90 million in net outflows on Monday. BTC has been stuck around the $86,000 midpoint for two days, failing twice to break $87,000.
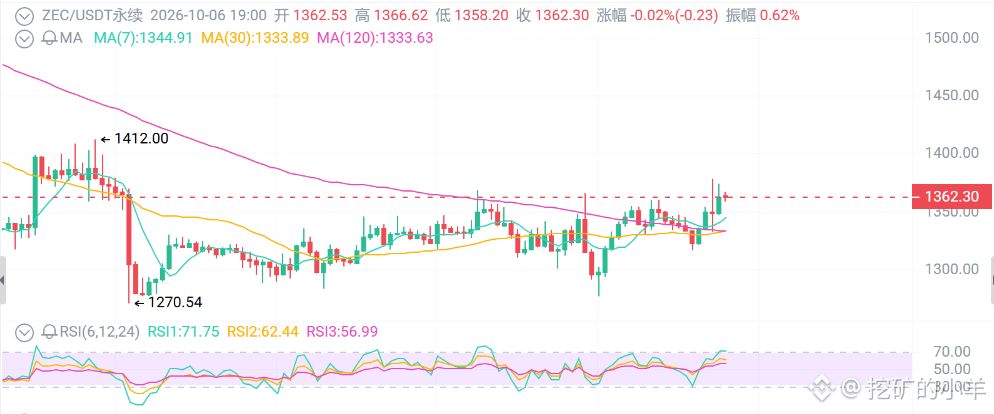
Third: The chart says 1,360 is resistance, not a starting point.
Today’s candle shows a bounce off the lows, but volume is average—not a high-volume breakout. The daily chart is still pulling back from overbought levels, with short-term moving averages pressing down.
1,360 sits at the top of the range. A close above 1,378 would mean it’s broken out of the range; a rally that fades could send it back to 1,300. If you chase it here, you’re buying at the ceiling of the range.
Resistance above: 1,360–1,378 (today’s high + supply zone) → 1,410–1,420 → 1,480–1,494
Support below: 1,330 → 1,300 → 1,270–1,280 (the lifeline) → 1,180–1,200
Trading strategies
Aggressive:
Wait for a pullback to 1,310–1,330, then enter with a small position. Stop-loss at 1,265; targets at 1,375 and 1,410.
Conservative:
Wait for 1,270–1,290 before considering an entry; stop-loss at 1,235. A better entry would be 1,180–1,220. If it doesn’t reach those levels, stick to a small position and don’t rush.
Breakout traders:
Only consider chasing if price breaks above 1,420 on strong volume and holds on a retest of 1,370. Targets: 1,480 and 1,540. If it’s a false breakout, walk away—don’t get attached.
Bears:
If price struggles to push higher in the 1,360–1,380 range, consider a small short position. Stop-loss at 1,405; targets at 1,310 and 1,280.
First, the surface picture: ZEC surged to 1,697 on September 26, then got hammered all the way down to 1,271 on October 3. Today it dipped to 1,280 before bouncing back to 1,360. It’s down 4%–15% over the past 7 days, up 15% over 30 days, and ranks tenth by market cap at $23 billion. Trading volume is up over the past 24 hours, and today’s daily candle has a long lower wick—a bounce off the lows. Every group chat is shouting, “ZEC is back—let’s go!”
But take three seconds to think: from 1,697, it’s already given back 20%. The 1,270–1,370 range is a box, and today’s price has reached the top—not the bottom.
First: the NU7 testnet was brought forward, but the mainnet hasn’t been approved. Don’t celebrate too soon.
On October 4, the NU7 testnet was activated ahead of schedule at block height 4465026. Block times were cut from 75 seconds to 25 seconds, 60% of fees go to the reserve, and the halving schedule remains unchanged.
Testnet = dress rehearsal; mainnet = opening night
Mainnet decision date: October 20
Target activation date: November 5
Second: The ETF channel is there, but the inflows have dried up.
Grayscale’s ZCSH split is complete. The fund previously had about $900 million in assets. Sounds like a lot?
But on Monday, ZEC-related funds saw small net outflows, weakening alongside BTC and ETH.
This isn’t a ZEC-specific blowup—the whole market is bleeding. Spot ETFs saw about $90 million in net outflows on Monday. BTC has been stuck around the $86,000 midpoint for two days, failing twice to break $87,000.
Third: The chart says 1,360 is resistance, not a starting point.
Today’s candle shows a bounce off the lows, but volume is average—not a high-volume breakout. The daily chart is still pulling back from overbought levels, with short-term moving averages pressing down.
1,360 sits at the top of the range. A close above 1,378 would mean it’s broken out of the range; a rally that fades could send it back to 1,300. If you chase it here, you’re buying at the ceiling of the range.
Resistance above: 1,360–1,378 (today’s high + supply zone) → 1,410–1,420 → 1,480–1,494
Support below: 1,330 → 1,300 → 1,270–1,280 (the lifeline) → 1,180–1,200
Trading strategies
Aggressive:
Wait for a pullback to 1,310–1,330, then enter with a small position. Stop-loss at 1,265; targets at 1,375 and 1,410.
Conservative:
Wait for 1,270–1,290 before considering an entry; stop-loss at 1,235. A better entry would be 1,180–1,220. If it doesn’t reach those levels, stick to a small position and don’t rush.
Breakout traders:
Only consider chasing if price breaks above 1,420 on strong volume and holds on a retest of 1,370. Targets: 1,480 and 1,540. If it’s a false breakout, walk away—don’t get attached.
Bears:
If price struggles to push higher in the 1,360–1,380 range, consider a small short position. Stop-loss at 1,405; targets at 1,310 and 1,280.