MINA Market Structure Analysis
Market Structure Observations
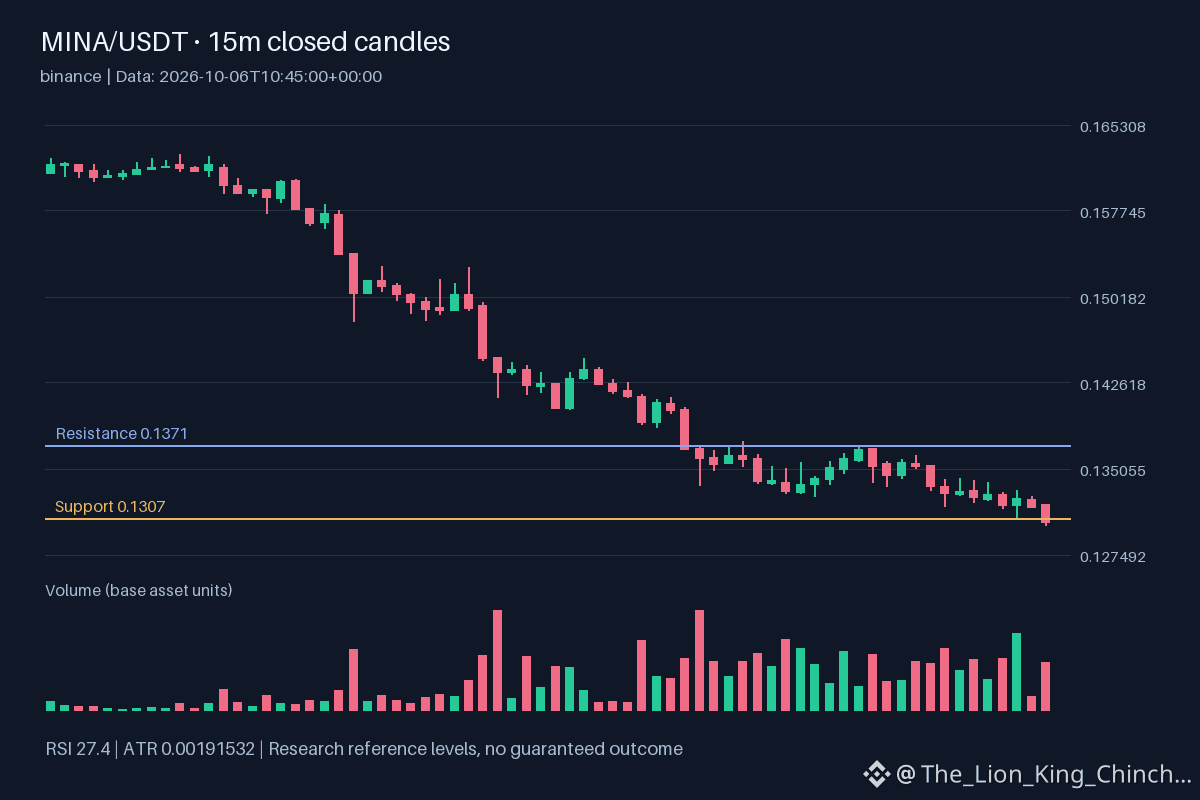
The current price action for $MINA indicates a downward hourly direction. Recent movements show the asset trading below 0.1307. Trading activity has been characterized by volume that remains above baseline levels. This recent price behavior follows a specific structure where the asset maintains a bearish posture relative to established support levels. Current momentum reflects these shifts in the intraday trend.
Technical Indicators and Volume
Observations regarding volatility and volume suggest active participation during these recent price shifts. While the hourly direction is down, the relative volume levels suggest that market participants are actively engaging with the current price levels. Monitoring how $MINA interacts with existing support is necessary to understand if the current trend persists or if a reversal occurs. The movement occurs within a context of higher than baseline volume, which typically impacts the strength of directional trends.
Potential Scenarios
If the price continues to trade below 0.1307, the downward hourly direction might intensify. Conversely, a shift in volume or price stability could alter the current structure. The relationship between volume and price remains a primary factor in assessing the sustainability of the current trend. Traders often monitor these levels to identify potential shifts in market sentiment or structure changes. Probabilistic market research, not a recommendation or guaranteed return.
Recorded evidence for $MINA:
Closed price: 0.1304 USDT.
Support: 0.1307 USDT.
Resistance: 0.1371 USDT.
Relative volume: 1.03733.
Source: binance. Closed-candle timestamp: 2026-10-06T10:45:00+00:00.
Market Structure Observations
The current price action for $MINA indicates a downward hourly direction. Recent movements show the asset trading below 0.1307. Trading activity has been characterized by volume that remains above baseline levels. This recent price behavior follows a specific structure where the asset maintains a bearish posture relative to established support levels. Current momentum reflects these shifts in the intraday trend.
Technical Indicators and Volume
Observations regarding volatility and volume suggest active participation during these recent price shifts. While the hourly direction is down, the relative volume levels suggest that market participants are actively engaging with the current price levels. Monitoring how $MINA interacts with existing support is necessary to understand if the current trend persists or if a reversal occurs. The movement occurs within a context of higher than baseline volume, which typically impacts the strength of directional trends.
Potential Scenarios
If the price continues to trade below 0.1307, the downward hourly direction might intensify. Conversely, a shift in volume or price stability could alter the current structure. The relationship between volume and price remains a primary factor in assessing the sustainability of the current trend. Traders often monitor these levels to identify potential shifts in market sentiment or structure changes. Probabilistic market research, not a recommendation or guaranteed return.
Recorded evidence for $MINA:
Closed price: 0.1304 USDT.
Support: 0.1307 USDT.
Resistance: 0.1371 USDT.
Relative volume: 1.03733.
Source: binance. Closed-candle timestamp: 2026-10-06T10:45:00+00:00.