


Key Takeaways
Bitcoin is trading around $85,453, down approximately 32% one year after reaching a record high above $126,000 on Oct. 6, 2025.
Previous cycles recorded much steeper one-year declines: 69.7% after the 2013 peak, 82.3% after the 2017 peak and 74.6% after the 2021 high.
Bitcoin's deepest decline this cycle was just over 53%, when BTC briefly fell below $59,000 on June 30.
Analysts attribute the shallower bear market partly to increased participation from ETFs, asset managers, family offices and corporations, alongside lower leverage.
Bitcoin's annualized volatility has fallen to around 40%, compared with historical levels above 80%, potentially pointing toward both milder crashes and less explosive rallies.
Bitcoin is down approximately 32% one year after reaching its record high above $126,000, marking a significantly shallower decline than at the same point in previous crypto bear markets.
BTC traded around $85,453 on Oct. 6, exactly one year after reaching its 2025 all-time high.
While a 32% decline would represent a major correction in traditional financial markets, Bitcoin's historical cycles have produced substantially deeper losses.
One year after its 2013 peak, Bitcoin was down 69.7%. The decline reached 82.3% one year after its December 2017 peak and 74.6% a year after the November 2021 high.
This time, the structure of the Bitcoin bear market looks markedly different.
Bitcoin Bear Market Drawdown Peaks at 53%
Bitcoin's maximum drawdown from its $126,000 record high reached slightly more than 53% when the cryptocurrency fell below $59,000 on June 30.
That remains considerably shallower than previous Bitcoin bear markets, which produced peak-to-trough declines of approximately 77% to 85%.
The timing has also changed.
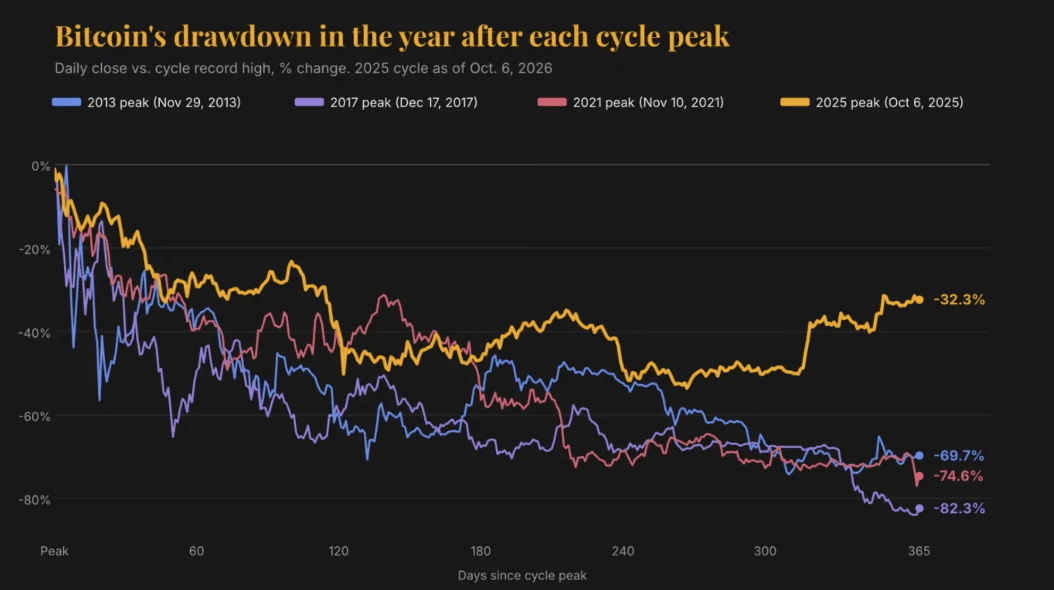
Rather than reaching its cycle low around a year or more after the market peak, Bitcoin bottomed approximately nine months after its October 2025 record, followed by a comparatively rapid recovery toward $85,000.
HashKey Group senior researcher Tim Sun described the shorter drawdown and reduced amount of time spent near the bottom as two of the most significant changes in the current cycle.
Bitcoin ETFs Change the Structure of the Market
One explanation is the changing composition of Bitcoin investors.
Previous bull markets were dominated more heavily by retail speculation and leverage. When those cycles reversed, forced liquidations, fund failures and exchange-related stress could amplify losses.
The 2023–2025 Bitcoin rally, by contrast, saw increased institutional participation through regulated products including spot Bitcoin ETFs.
Asset managers, family offices and corporations have also become larger sources of Bitcoin demand.
That capital can behave differently from highly leveraged speculative flows. Griffin Ardern, co-founder and volatility desk portfolio manager at Primal Fund, noted that ETF allocation strategies can rebalance toward target portfolio weights, meaning they may buy during periods of market weakness.
Crypto Leverage Was Cleared Near Bitcoin's Peak
Lower leverage may also help explain why Bitcoin has avoided the cascading sell-offs associated with earlier bear markets.
A major deleveraging event occurred on Oct. 10, 2025, when a macro-driven market sell-off triggered more than $19 billion in crypto derivatives liquidations.
According to Ardern, leverage was heavily reduced around the market top and never fully returned.
Instead of cascading liquidations rapidly pushing Bitcoin down roughly 80%, BTC took around nine months to reach a maximum decline of approximately 53%.
Lower Bitcoin Volatility Means Shallower Crashes — and Rallies
Greater institutional participation comes with another structural shift: declining Bitcoin volatility.
Bitcoin's annualized volatility currently stands around 40%, according to Sun, substantially below long-term historical levels exceeding 80%.
Bitcoin options markets tell a similar story. Ardern said the DVOL implied volatility index has remained around 35.
Jeff Anderson, head of U.S. at STS Digital, argued that as Bitcoin matures and participation expands, declining realized volatility should produce both shallower drawdowns and lower market peaks.
The implication is that Bitcoin's future cycles could increasingly resemble a staircase — gradual advances interrupted by corrections and relatively rapid recoveries — rather than the extreme parabolic rallies and 80%-plus crashes historically associated with the cryptocurrency.
Bitcoin Supply Could Still Trigger Sharp Price Rallies
Lower volatility does not necessarily eliminate the possibility of explosive Bitcoin moves.
Bitcoin's supply remains capped at 21 million BTC, while a substantial share of circulating supply is held by long-term investors.
That means sudden ETF inflows, improving global liquidity or concentrated short covering could still create a significant imbalance between marginal demand and available supply.
Under those conditions, even a more mature Bitcoin market could experience nonlinear price increases.
Treasury Yields Remain a Key Risk for Bitcoin
The derivatives market, however, is not yet aggressively positioned for another major Bitcoin rally.
Ardern noted that implied volatility remains near historically low levels, while one-year options skew remains neutral to bearish, suggesting traders are not paying heavily for bullish upside exposure.
One major macroeconomic risk is the U.S. Treasury market.
The 30-year Treasury yield recently reached 5.7%, its highest level since 2002, after rising more than 80 basis points this year.
Higher long-term yields increase the opportunity cost of holding non-yielding assets and can tighten broader financial conditions.
For Bitcoin, that means the unusually shallow 2025–2026 bear market may represent a structural change — but whether it remains shallow could ultimately depend as much on U.S. interest rates, liquidity and institutional capital flows as on Bitcoin's own market cycle.