AIN at $0.055—would you dare go long?
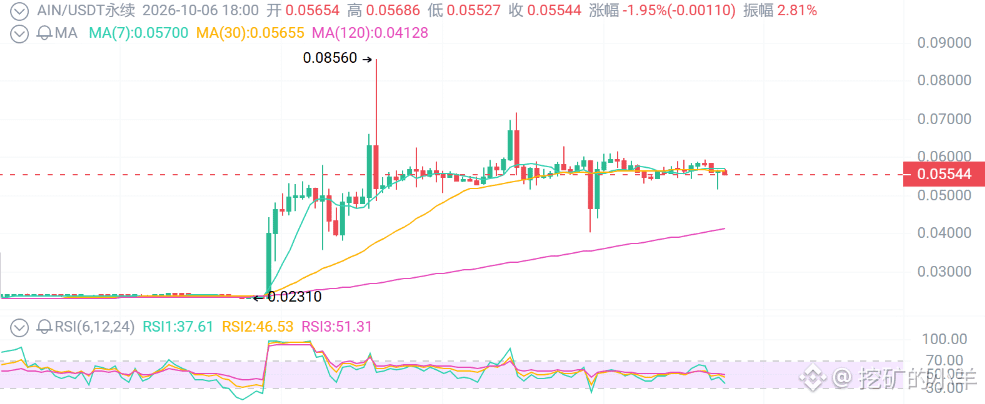
First, the numbers: On October 2, it was still sitting at $0.023–$0.024. On October 3, it shot straight up to $0.058, then surged to $0.0856 on October 4 before crashing to $0.038. It bounced to $0.0716 on October 5, then fell back to $0.040. It’s more than doubled in the past 7 days, but is still down over the past 30 days and down 60% over the past year. The 4-hour funding rate is +0.08% to +0.10%, equivalent to an annualized 150%–175%.
First: No announcement, no product—just speculative flows.
I combed through the public news and couldn’t find any product announcement that explains this rally.
This isn’t a return of risk appetite across the whole market, nor a sudden explosion in the AI narrative. It’s just the token riding a wave of speculative flows in perpetuals. CMC is still saying today: “No catalyst, volume fading, weak around $0.055.”
Second: With funding annualized at 175%, longs are paying to be crowded.
The 4-hour funding rate is +0.08% to +0.10%, equivalent to an annualized 150%–175%.
Such extremely positive rates usually show up near the end of a sharp move, not at the starting point. At a genuine breakout, funding is often flat or even negative.
At $0.055, it’s more than twice as expensive as $0.024, and only about 30% below $0.086. You’re not buying “cheap”—the spike has already happened.
Third: Technically, it’s just a range. Don’t fantasize about a return to $0.085.
$0.023 base → $0.058 → peak at $0.086 → $0.038 → $0.072 → $0.040 → $0.055 now.
The daily moving averages have been lifted by two days of gains; that doesn’t mean support is solid. The 4-hour chart is consolidating after the crash, with far less volume than the October 4 peak. $0.055 is in the middle of the $0.040–$0.072 range.
If it holds $0.050, the move could still count as a recovery. A daily close below $0.040 means treating it as a deeper short-term correction.
Resistance above: $0.060 → $0.062 (make-or-break level) → $0.071–$0.072 → $0.085
Support below: $0.050 → $0.040 → $0.038 → $0.023–$0.024
Trading strategy
Aggressive:
I don’t recommend going long around $0.055. If you insist, only take a very small position if it stabilizes at $0.048–$0.050, with a stop-loss at $0.044 and a target of $0.060. Exit at $0.058.
Conservative:
Wait for $0.040–$0.042 before considering an entry, with a stop-loss at $0.036. If it doesn’t reach that level, stay out and watch how it behaves at $0.062.
Breakout traders:
Only consider chasing if it holds above $0.062 on strong volume and then retests $0.055 without breaking below it. Target $0.070. Don’t use $0.085 as a target.
Shorts:
If it struggles to push higher around $0.060–$0.063, you could open a very small short for a pullback, with a stop-loss at $0.066 and targets at $0.050 and $0.042.
First, the numbers: On October 2, it was still sitting at $0.023–$0.024. On October 3, it shot straight up to $0.058, then surged to $0.0856 on October 4 before crashing to $0.038. It bounced to $0.0716 on October 5, then fell back to $0.040. It’s more than doubled in the past 7 days, but is still down over the past 30 days and down 60% over the past year. The 4-hour funding rate is +0.08% to +0.10%, equivalent to an annualized 150%–175%.
First: No announcement, no product—just speculative flows.
I combed through the public news and couldn’t find any product announcement that explains this rally.
This isn’t a return of risk appetite across the whole market, nor a sudden explosion in the AI narrative. It’s just the token riding a wave of speculative flows in perpetuals. CMC is still saying today: “No catalyst, volume fading, weak around $0.055.”
Second: With funding annualized at 175%, longs are paying to be crowded.
The 4-hour funding rate is +0.08% to +0.10%, equivalent to an annualized 150%–175%.
Such extremely positive rates usually show up near the end of a sharp move, not at the starting point. At a genuine breakout, funding is often flat or even negative.
At $0.055, it’s more than twice as expensive as $0.024, and only about 30% below $0.086. You’re not buying “cheap”—the spike has already happened.
Third: Technically, it’s just a range. Don’t fantasize about a return to $0.085.
$0.023 base → $0.058 → peak at $0.086 → $0.038 → $0.072 → $0.040 → $0.055 now.
The daily moving averages have been lifted by two days of gains; that doesn’t mean support is solid. The 4-hour chart is consolidating after the crash, with far less volume than the October 4 peak. $0.055 is in the middle of the $0.040–$0.072 range.
If it holds $0.050, the move could still count as a recovery. A daily close below $0.040 means treating it as a deeper short-term correction.
Resistance above: $0.060 → $0.062 (make-or-break level) → $0.071–$0.072 → $0.085
Support below: $0.050 → $0.040 → $0.038 → $0.023–$0.024
Trading strategy
Aggressive:
I don’t recommend going long around $0.055. If you insist, only take a very small position if it stabilizes at $0.048–$0.050, with a stop-loss at $0.044 and a target of $0.060. Exit at $0.058.
Conservative:
Wait for $0.040–$0.042 before considering an entry, with a stop-loss at $0.036. If it doesn’t reach that level, stay out and watch how it behaves at $0.062.
Breakout traders:
Only consider chasing if it holds above $0.062 on strong volume and then retests $0.055 without breaking below it. Target $0.070. Don’t use $0.085 as a target.
Shorts:
If it struggles to push higher around $0.060–$0.063, you could open a very small short for a pullback, with a stop-loss at $0.066 and targets at $0.050 and $0.042.