



Despite cooling ETF demand, DOGE’s technical indicators are flashing strong bullish signals. Dogecoin (DOGE) fell 2% over 24 hours, trading at $0.094 on October 6. However, behind the seemingly subdued price action, several technical indicators and on-chain metrics are sending compelling signals—a golden cross has appeared on the daily chart, open interest (OI) has surged to $1.52 billion, and analysts are predicting the start of a new bull run.
Analysts Turn Bullish: Is a Breakout Imminent?
Several analysts are optimistic about Dogecoin’s prospects. Ali Martinez recently noted that Dogecoin is poised to break out after consolidating within a descending triangle. He said that if Dogecoin can close above the $0.095 resistance level, it could confirm a bullish breakout and potentially drive the price up to $0.106.
Another analyst, Sweeped, also spotted the same descending triangle on Dogecoin’s four-hour chart, noting that the top meme coin could be one of the first altcoins to “explode” in Q4 2026.
Analyst TMA has identified a broader narrative: Dogecoin is repeating its 2024 bull-market fractal, which could signal gains of more than fivefold.
“Dogecoin is breaking upward out of a multi-year support zone and has already broken above a multi-year downtrend line. From this level in 2024, Dogecoin could gain more than 500%,” TMA said.
Open interest surges, but the long/short ratio falls
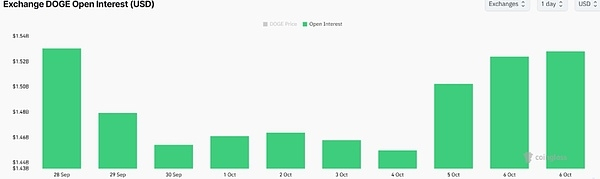
CoinGlass data shows that Dogecoin open interest edged up 0.55% to $1.52 billion. Despite a 2% drop in Dogecoin’s price, open interest remains at its highest level since September 28.
Notably, high open interest coincided with the long/short ratio falling to 0.89, indicating that short accounts are growing faster than long accounts. Demand for short positions is increasing even as demand for Dogecoin ETFs weakens.
As CoinGape previously reported, Dogecoin ETFs recorded their largest weekly inflows ever during the week ending September 25. However, demand has cooled considerably since then. According to the data, the ETFs recorded inflows of just $327,000 last week, with no inflows so far this week.
A golden cross appears—will history repeat itself?
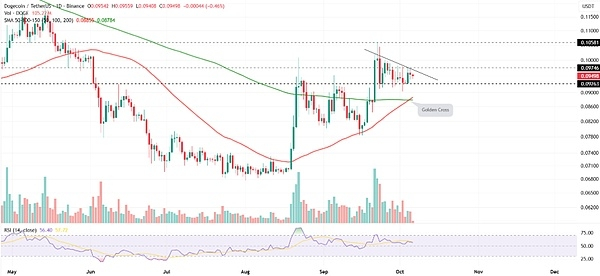
Dogecoin’s price formed a golden cross on the daily chart after the 50-day moving average crossed above the 200-day moving average. A golden cross typically signals a shift in market sentiment from bearish to bullish.
However, historical data shows that the last time Dogecoin formed a golden cross was in August 2025, and the price did not surge immediately. Instead, it initially fell, then rebounded 42% a month after the crossover. Whether history will repeat itself in a similar way this time is worth watching closely.
The RSI reading of 55 indicates that momentum remains bullish despite today’s decline. However, Dogecoin’s price still needs to close above resistance at $0.097 to confirm a move toward September’s high of $0.105.
Key levels at a glance
Upside levels: $0.095 is near-term resistance; a breakout would confirm a bullish outlook. The key resistance level is $0.097, and a close above it could open the door to further gains. The September high and analysts’ target lie at $0.105–$0.106.
Downside levels: $0.092 is near-term support, while the 50-day moving average at $0.088 offers support. A break below these levels could lead to further declines.
Market sentiment backdrop
Analysts remain optimistic about Dogecoin’s prospects, while the Crypto Fear & Greed Index is still in “Greed” territory and Bitcoin is approaching resistance at $85,000. The improving overall market sentiment could support the performance of altcoins like Dogecoin.