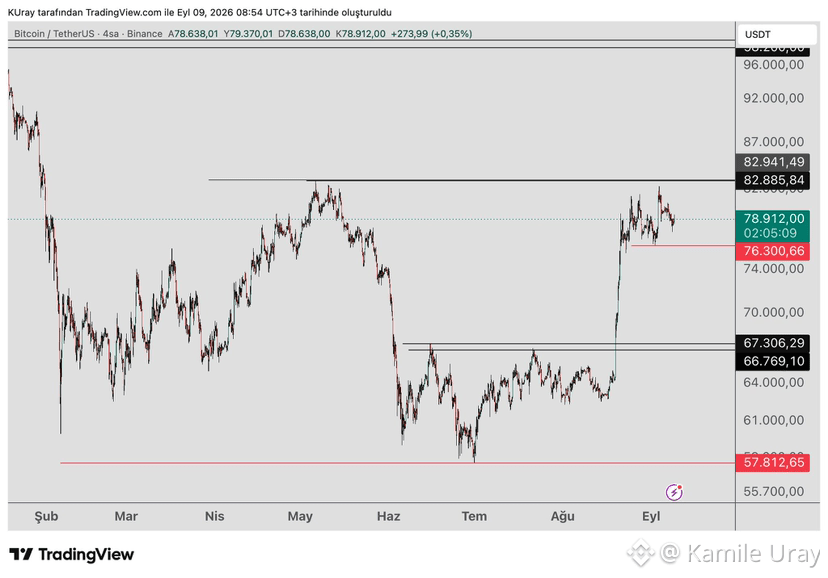
We are watching the 82,616 level on the #BTC 4-hour chart. The rise may continue as long as the price stays above this level. If it fails to hold above 82,616, keep an eye on the 74,892 level as support. If the price holds there, the rise could still continue.
On the way up, the 98,000 and 107,000–109,000 zones are resistance levels. A bearish Libra pattern may form if the price reaches the 107,000–109,000 zone. If it does, a decline is expected unless the price closes a weekly candle above 126,000.
If the price closes below 74,892, the decline is expected to continue. On the way down, we are watching the 67,306–66,769 zones for support.
On the way up, the 98,000 and 107,000–109,000 zones are resistance levels. A bearish Libra pattern may form if the price reaches the 107,000–109,000 zone. If it does, a decline is expected unless the price closes a weekly candle above 126,000.
If the price closes below 74,892, the decline is expected to continue. On the way down, we are watching the 67,306–66,769 zones for support.