The strategy gained 8%, so why did the money invested along the way end up losing money?
Let’s work it out with a set of purely hypothetical numbers. Fees are ignored, and these figures do not represent any actual live-trading performance.
You initially invest 100. In the first period, it earns 20%, bringing the account to 120. Seeing a gain, you invest another 880, bringing the account to 1,000. In the second period, it loses 10%, leaving you with 900. You invested 980 in total, so you’re down 80.
But if you link the strategy’s returns across the two periods, 1.2 multiplied by 0.9 equals 1.08, so the time-weighted return is still positive 8%. Both results can be true at the same time: less money was invested during the rising period, and more during the falling period.
The GIPS standards explain that the time-weighted method is used to eliminate the effects of external cash flows, making it easier to evaluate investment management performance. Taking into account when and how much money was invested answers a different question: what happened to an individual investor’s money? These two questions cannot be answered with the same percentage.
So when I look at BTC, ETH, and SOL strategy records, I also keep track of the dates and amounts of every deposit and withdrawal, then check my personal net profit or loss. Don’t mistake a good-looking performance curve for the returns you would have earned by adding money at any point along the way.
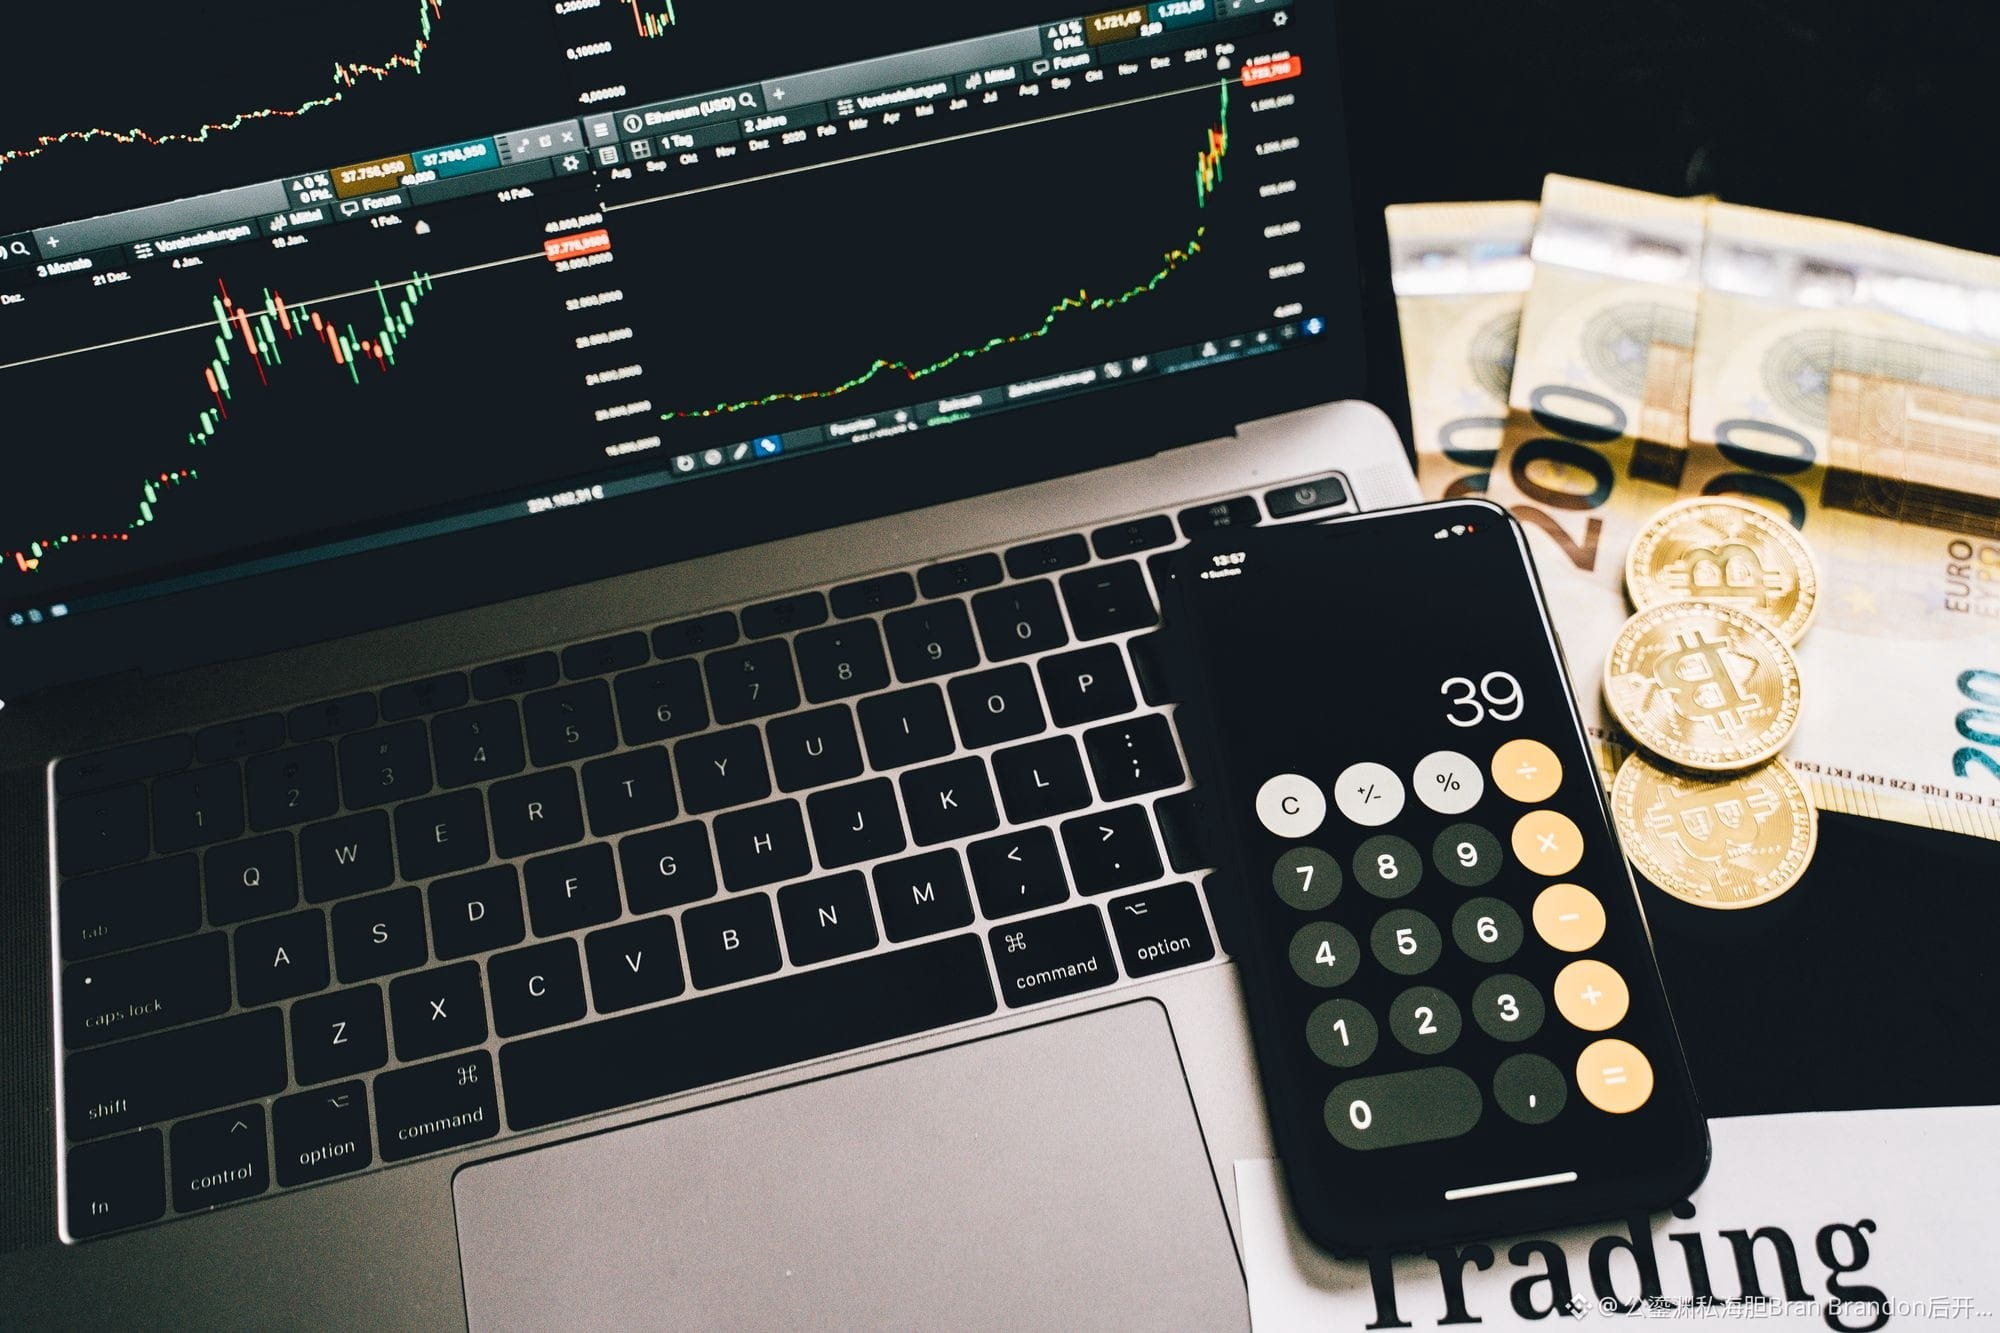
This isn’t an attempt to make excuses for losses. Strategy performance must be based on accurate, complete records, and personal returns must be calculated from your own transactions. The accompanying image shows a historical financial calculation; the screen does not display real-time market data.
$BTC $ETH $SOL #TradingInsights
Tap my profile picture to view the live trading account
Let’s work it out with a set of purely hypothetical numbers. Fees are ignored, and these figures do not represent any actual live-trading performance.
You initially invest 100. In the first period, it earns 20%, bringing the account to 120. Seeing a gain, you invest another 880, bringing the account to 1,000. In the second period, it loses 10%, leaving you with 900. You invested 980 in total, so you’re down 80.
But if you link the strategy’s returns across the two periods, 1.2 multiplied by 0.9 equals 1.08, so the time-weighted return is still positive 8%. Both results can be true at the same time: less money was invested during the rising period, and more during the falling period.
The GIPS standards explain that the time-weighted method is used to eliminate the effects of external cash flows, making it easier to evaluate investment management performance. Taking into account when and how much money was invested answers a different question: what happened to an individual investor’s money? These two questions cannot be answered with the same percentage.
So when I look at BTC, ETH, and SOL strategy records, I also keep track of the dates and amounts of every deposit and withdrawal, then check my personal net profit or loss. Don’t mistake a good-looking performance curve for the returns you would have earned by adding money at any point along the way.
This isn’t an attempt to make excuses for losses. Strategy performance must be based on accurate, complete records, and personal returns must be calculated from your own transactions. The accompanying image shows a historical financial calculation; the screen does not display real-time market data.
$BTC $ETH $SOL #TradingInsights
Tap my profile picture to view the live trading account