【Trending claim “Nikkei up 2.5%” is outdated: closed up 1.05% on October 6】
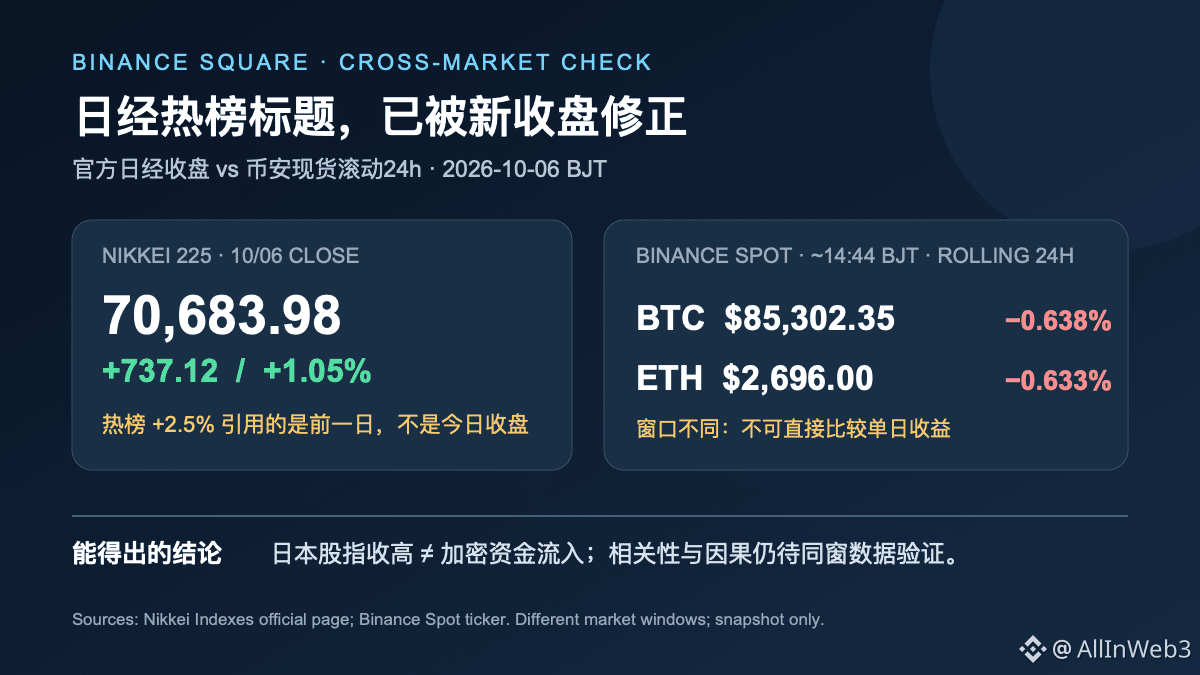
This update fills the Top 7 spot based on Binance Square’s real-time ranking: “Nikkei225Jumps2.5%ToThreeMonthHigh.” At 14:43 Beijing time, the topic page showed 97,565 views and 1,276 people discussing it, but the popular posts still cited the previous trading day’s close of 69,946.86 points, up 2.4%. The Nikkei’s official page updated after Japan’s cash market closed: on October 6, the index closed at 70,683.98, up 737.12 points, or 1.05%. So “2.5%” does not reflect today’s closing performance. More accurately, the index extended its gains after a sharp rise the previous day, but its daily gain narrowed.
This update describes only a Japanese stock index. It cannot be taken as direct evidence of stronger global risk appetite, much less as a signal of capital inflows into crypto assets. For comparison, Binance spot rolling 24-hour quotes (around 14:44) showed BTC at $85,302.35, down 0.638%, and ETH at $2,696, down 0.633%. The two figures use different measurement windows, so BTC and ETH’s 24-hour losses cannot be strictly compared with the Nikkei’s one-day closing return. They simply serve as a reminder not to extrapolate one equity index’s positive return to the crypto market. Nor do these figures establish a causal relationship between the assets.
What’s worth tracking is whether the move continues on the next trading day: whether the Nikkei holds above 70,000 and whether gains broaden to more constituents. For crypto, use spot and perpetual trading volumes, funding rates, and open interest measured at the same time to assess buying demand in that market, rather than using Japan’s market close as a proxy. If the Nikkei retreats, or BTC/ETH strengthen over their respective measurement windows, this “stocks strong, crypto weak” snapshot could change. Current information is insufficient to support a cross-market directional view; the next Japanese trading day and crypto data from a matching time window should be reviewed first.
Methodology: The Nikkei figure is the October 6 close of Japan’s cash equity market; BTC/ETH figures are Binance spot rolling 24-hour ticker snapshots. The two sets of figures are not synchronized, do not constitute investment advice, and do not indicate that Japanese equities caused crypto assets to move.
This update fills the Top 7 spot based on Binance Square’s real-time ranking: “Nikkei225Jumps2.5%ToThreeMonthHigh.” At 14:43 Beijing time, the topic page showed 97,565 views and 1,276 people discussing it, but the popular posts still cited the previous trading day’s close of 69,946.86 points, up 2.4%. The Nikkei’s official page updated after Japan’s cash market closed: on October 6, the index closed at 70,683.98, up 737.12 points, or 1.05%. So “2.5%” does not reflect today’s closing performance. More accurately, the index extended its gains after a sharp rise the previous day, but its daily gain narrowed.
This update describes only a Japanese stock index. It cannot be taken as direct evidence of stronger global risk appetite, much less as a signal of capital inflows into crypto assets. For comparison, Binance spot rolling 24-hour quotes (around 14:44) showed BTC at $85,302.35, down 0.638%, and ETH at $2,696, down 0.633%. The two figures use different measurement windows, so BTC and ETH’s 24-hour losses cannot be strictly compared with the Nikkei’s one-day closing return. They simply serve as a reminder not to extrapolate one equity index’s positive return to the crypto market. Nor do these figures establish a causal relationship between the assets.
What’s worth tracking is whether the move continues on the next trading day: whether the Nikkei holds above 70,000 and whether gains broaden to more constituents. For crypto, use spot and perpetual trading volumes, funding rates, and open interest measured at the same time to assess buying demand in that market, rather than using Japan’s market close as a proxy. If the Nikkei retreats, or BTC/ETH strengthen over their respective measurement windows, this “stocks strong, crypto weak” snapshot could change. Current information is insufficient to support a cross-market directional view; the next Japanese trading day and crypto data from a matching time window should be reviewed first.
Methodology: The Nikkei figure is the October 6 close of Japan’s cash equity market; BTC/ETH figures are Binance spot rolling 24-hour ticker snapshots. The two sets of figures are not synchronized, do not constitute investment advice, and do not indicate that Japanese equities caused crypto assets to move.