The funding rate is wildly negative, yet the price is rising. Is this the shorts’ last stand, or a trap set by the bulls? My answer: this is a classic short-squeeze structure, with capital taking the bulls’ side.
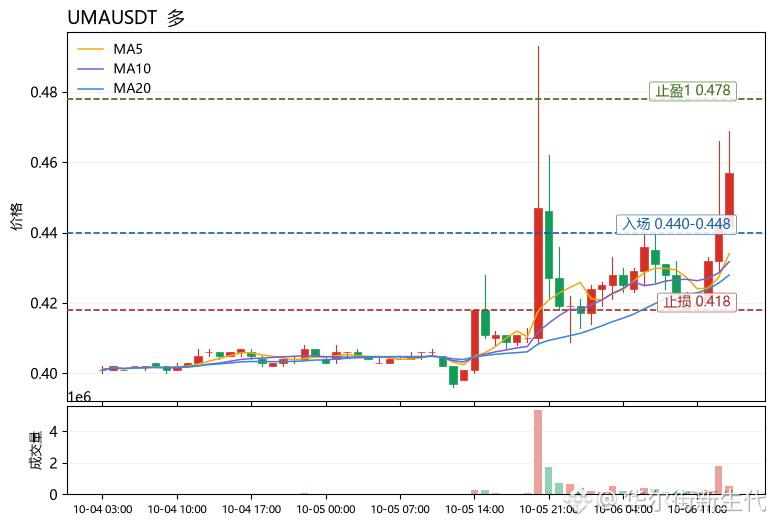
$UMA Current price: 0.457, up 13.40% over 24 hours, while the funding rate is -0.2705%. This negative reading stands out sharply in a rising market—it means shorts in the derivatives market are still paying longs. The shorts haven’t given up; they’re adding to their positions. Meanwhile, the price has moved above MA5 (0.434) and MA20 (0.4279), and the MACD histogram has turned positive at +0.001861, confirming bullish momentum. RSI at 69.9 is nearing overbought territory, and the price has broken above the Bollinger upper band at 0.4496, indicating a risk of a short-term wick and pullback, but the trend direction remains unchanged. The Fear and Greed Index is at 73, in the greed zone—sentiment is heated, but not extreme. Overall, as long as the funding rate remains negative, short covering will continue to provide buying pressure.
For trading, consider entering a long position on a pullback into the 0.440–0.448 range. This zone is a confluence of support from the Bollinger upper band and MA5, as well as a retest confirmation area after the breakout. Take-profit 1 is 0.478, the extended target at the upper end of the 30-candle range; take-profit 2 is 0.502, a psychological level in the previous-high resistance zone. Set the stop-loss at 0.418. A break below MA20 and the loss of the Bollinger middle band would invalidate the bullish structure.
Also worth watching: $ZRO is relatively steadier, with room to move as its RSI is only 56.4; $ORCA has risen more sharply, but its RSI of 72.6 is already overheated. The divergence in relative strength is clear.
(Personal opinion only, for reference; this is not investment advice. Derivatives trading carries very high risk. Please manage position size strictly.)
[Data]
Coin: UMAUSDT
Direction: Long
Entry: 0.440-0.448
Take-profit 1: 0.478
Take-profit 2: 0.502
Stop-loss: 0.418
$UMA Current price: 0.457, up 13.40% over 24 hours, while the funding rate is -0.2705%. This negative reading stands out sharply in a rising market—it means shorts in the derivatives market are still paying longs. The shorts haven’t given up; they’re adding to their positions. Meanwhile, the price has moved above MA5 (0.434) and MA20 (0.4279), and the MACD histogram has turned positive at +0.001861, confirming bullish momentum. RSI at 69.9 is nearing overbought territory, and the price has broken above the Bollinger upper band at 0.4496, indicating a risk of a short-term wick and pullback, but the trend direction remains unchanged. The Fear and Greed Index is at 73, in the greed zone—sentiment is heated, but not extreme. Overall, as long as the funding rate remains negative, short covering will continue to provide buying pressure.
For trading, consider entering a long position on a pullback into the 0.440–0.448 range. This zone is a confluence of support from the Bollinger upper band and MA5, as well as a retest confirmation area after the breakout. Take-profit 1 is 0.478, the extended target at the upper end of the 30-candle range; take-profit 2 is 0.502, a psychological level in the previous-high resistance zone. Set the stop-loss at 0.418. A break below MA20 and the loss of the Bollinger middle band would invalidate the bullish structure.
Also worth watching: $ZRO is relatively steadier, with room to move as its RSI is only 56.4; $ORCA has risen more sharply, but its RSI of 72.6 is already overheated. The divergence in relative strength is clear.
(Personal opinion only, for reference; this is not investment advice. Derivatives trading carries very high risk. Please manage position size strictly.)
[Data]
Coin: UMAUSDT
Direction: Long
Entry: 0.440-0.448
Take-profit 1: 0.478
Take-profit 2: 0.502
Stop-loss: 0.418