$RLC remains in an extremely volatile zone, but the new evidence in this move is a series of recoveries after a sharp drop—not confirmation of a breakout. Binance’s full scan at 13:01 Beijing time covered 523 normally trading USDT-margined perpetuals. RLC ranked first by gain, up 106.425% over 24 hours, with a current price of 0.7646 and approximately $729 million in quote volume. It still ranked first in the 13:05 pre-publication rescan, with gains rising to 108.253% and the price at 0.7747. The short-term change itself shows that the leaderboard figures are unstable; the ranking should not be treated as a directional signal.
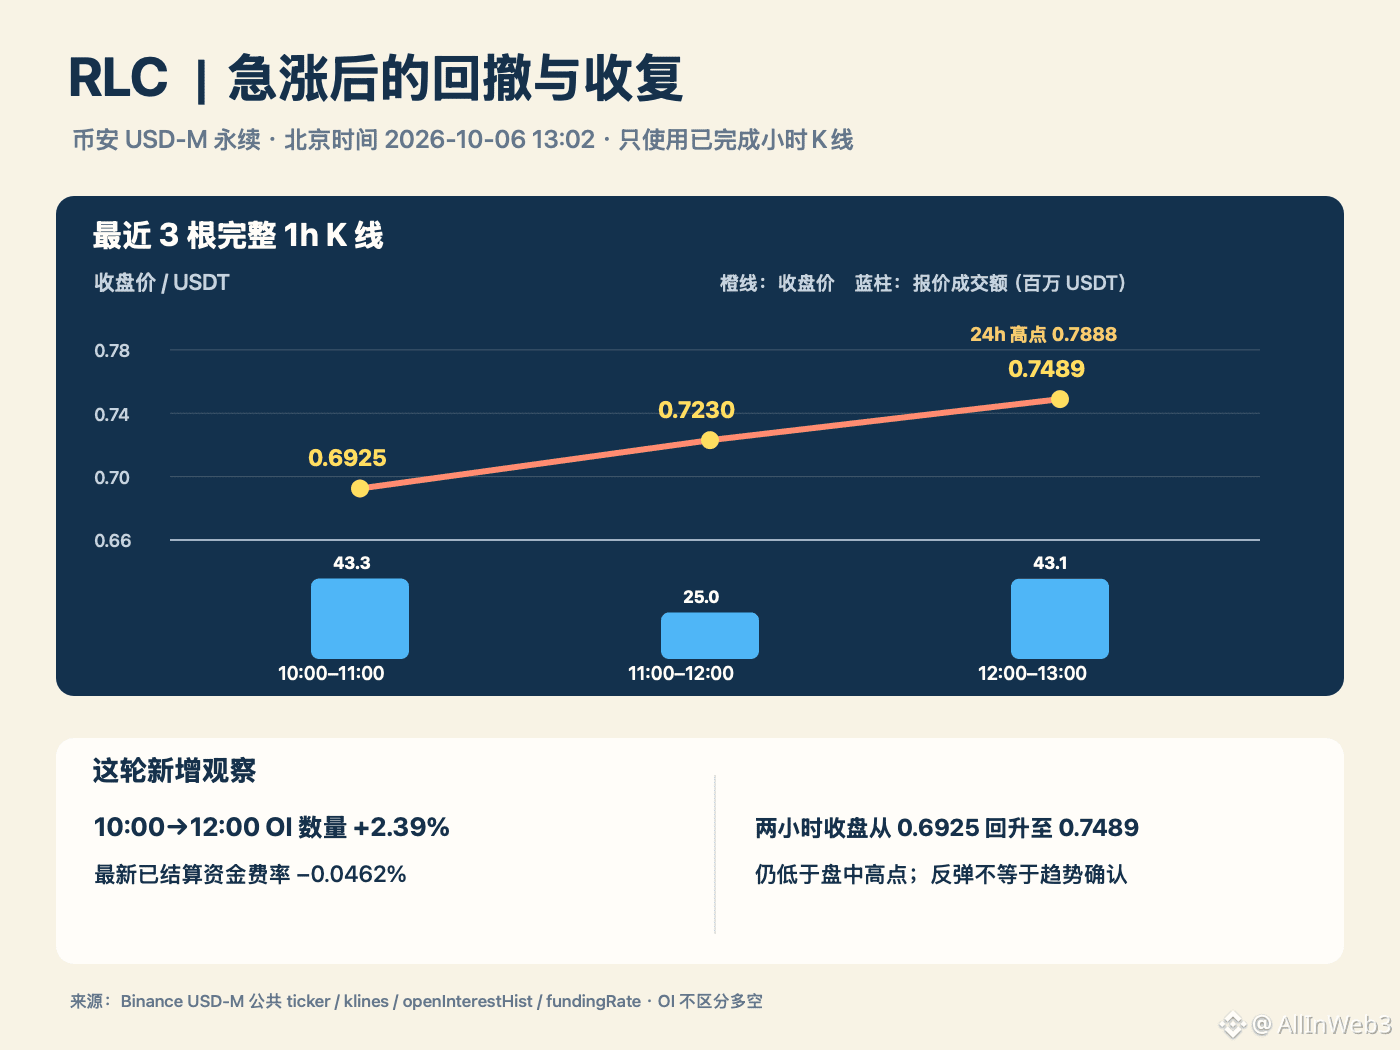
Compared with the 10:16 analysis focused on “divergence between price and positions at elevated levels,” the hourly path has changed: from 10:00 to 11:00, the price fell back from 0.7293 to close at 0.6925; the next two completed hourly candles closed at 0.7230 and 0.7489, respectively, for a cumulative rebound of about 8.15% over the latter two hours. However, the 0.7489 close remained about 5.1% below the previous 24-hour high of 0.7888, and quote volume from 12:00 to 13:00 was about $43.12 million. This shows that buying support emerged after selling pressure, but does not prove that the high has been broken or that the trend has reversed. Quote volume across the three hourly candles was about $43.26 million, $25.03 million, and $43.12 million. The latest figure was up about 72% from the previous hour, but was close to the level during the 10:00 pullback. Trading volume does not indicate the direction of buying or selling and cannot be equated with net buying.
The open-interest sample rose from about 24.98 million tokens at 10:00 to about 25.58 million at 12:00, an increase of about 2.39%. The latest funding rate, settled at 13:00, was −0.0462%. Rising OI does not distinguish between longs and shorts and does not mean net capital inflows; a negative funding rate only reflects the contract pricing relationship at settlement and is not enough to conclude that a short squeeze is underway. To assess whether the recovery can continue, watch whether the closes and trading volume of subsequent completed hourly candles confirm it.
The privacy roadmap available on the iExec website was published in December 2025 and was not a simultaneous announcement tied to this move. So far, no single new catalyst has been verified to explain the sharp rally. Next, watch whether a completed hourly candle can reclaim 0.7888 with supporting volume. If the price falls back and closes below the current move’s low near 0.6802, the recovery structure will need to be reassessed. Both price levels are conditions to monitor, not entry instructions. Data timestamps: initial scan at 13:01, pre-publication rescan at 13:05, and single-token data at 13:02 Beijing time.
Compared with the 10:16 analysis focused on “divergence between price and positions at elevated levels,” the hourly path has changed: from 10:00 to 11:00, the price fell back from 0.7293 to close at 0.6925; the next two completed hourly candles closed at 0.7230 and 0.7489, respectively, for a cumulative rebound of about 8.15% over the latter two hours. However, the 0.7489 close remained about 5.1% below the previous 24-hour high of 0.7888, and quote volume from 12:00 to 13:00 was about $43.12 million. This shows that buying support emerged after selling pressure, but does not prove that the high has been broken or that the trend has reversed. Quote volume across the three hourly candles was about $43.26 million, $25.03 million, and $43.12 million. The latest figure was up about 72% from the previous hour, but was close to the level during the 10:00 pullback. Trading volume does not indicate the direction of buying or selling and cannot be equated with net buying.
The open-interest sample rose from about 24.98 million tokens at 10:00 to about 25.58 million at 12:00, an increase of about 2.39%. The latest funding rate, settled at 13:00, was −0.0462%. Rising OI does not distinguish between longs and shorts and does not mean net capital inflows; a negative funding rate only reflects the contract pricing relationship at settlement and is not enough to conclude that a short squeeze is underway. To assess whether the recovery can continue, watch whether the closes and trading volume of subsequent completed hourly candles confirm it.
The privacy roadmap available on the iExec website was published in December 2025 and was not a simultaneous announcement tied to this move. So far, no single new catalyst has been verified to explain the sharp rally. Next, watch whether a completed hourly candle can reclaim 0.7888 with supporting volume. If the price falls back and closes below the current move’s low near 0.6802, the recovery structure will need to be reassessed. Both price levels are conditions to monitor, not entry instructions. Data timestamps: initial scan at 13:01, pre-publication rescan at 13:05, and single-token data at 13:02 Beijing time.