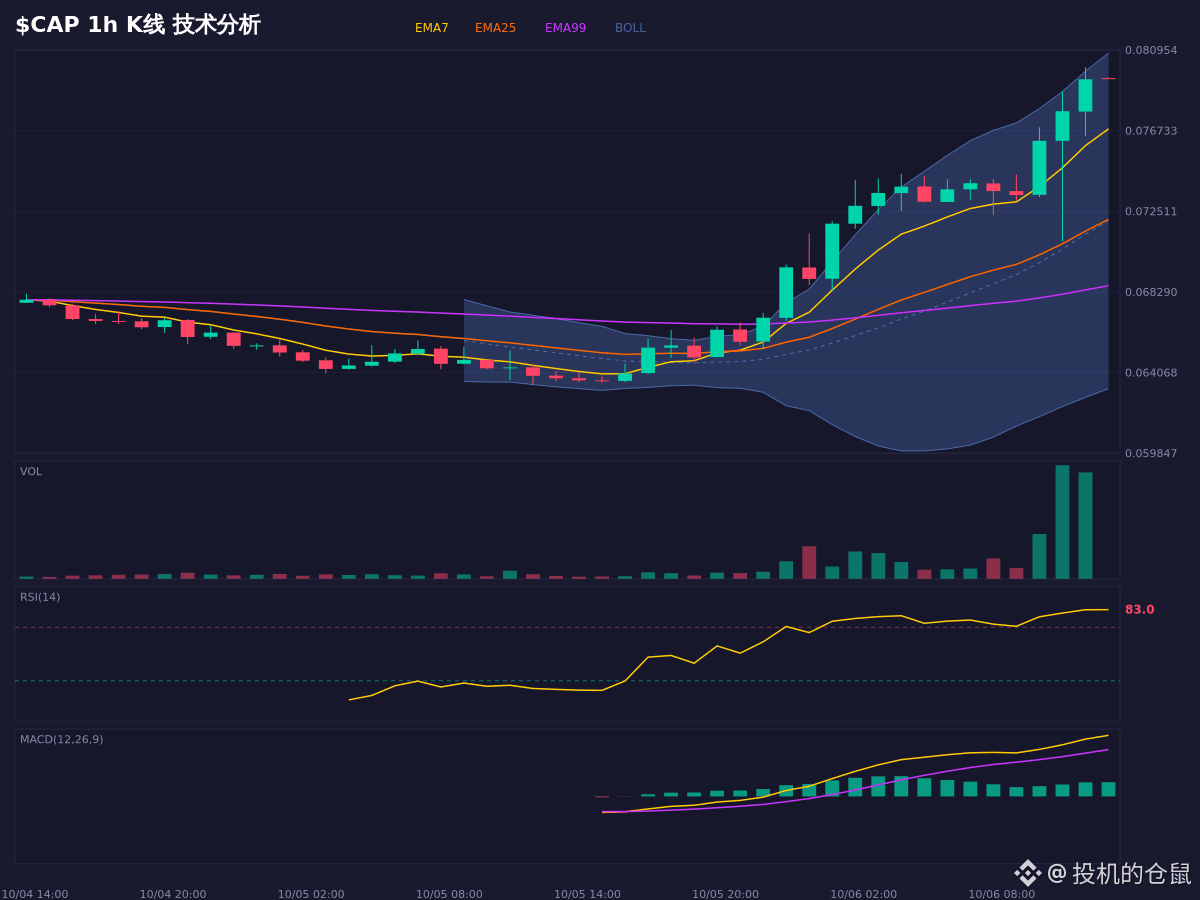
Today, $CAP ’s technical setup looks interesting. The moving averages are beautifully aligned in a bullish formation: EMA7 > EMA25 > EMA99, indicating a strong trend. But the 1-hour RSI is at 83.1, deep in overbought territory—a classic signal of bearish divergence at elevated levels. MACD bullish momentum remains strong, but there’s clear short-term pullback pressure.
Here’s the contradiction: the trend is bullish, but the market is severely overbought. If the price can hold around 0.072 in the short term (the EMA25 level), the bullish structure may continue. But if it breaks below 0.0687, the current thesis no longer holds. OBV shows continued inflows, suggesting that buying pressure is indeed building.
This move in $CAP is a classic battle between bulls and bears—fascinating to watch. For market observation and conditional analysis only; this is not a record of trading activity.
$CAP #市场情绪 #熊市 #MarketAnalysis
Here’s the contradiction: the trend is bullish, but the market is severely overbought. If the price can hold around 0.072 in the short term (the EMA25 level), the bullish structure may continue. But if it breaks below 0.0687, the current thesis no longer holds. OBV shows continued inflows, suggesting that buying pressure is indeed building.
This move in $CAP is a classic battle between bulls and bears—fascinating to watch. For market observation and conditional analysis only; this is not a record of trading activity.
$CAP #市场情绪 #熊市 #MarketAnalysis