2026-10-06_Daily Multi-Timeframe Resonance: Bullish Potential Coins 1/5
The ranking does not indicate priority or constitute trading advice. Before trading, check the price trend again and watch for divergences.
════════════════════
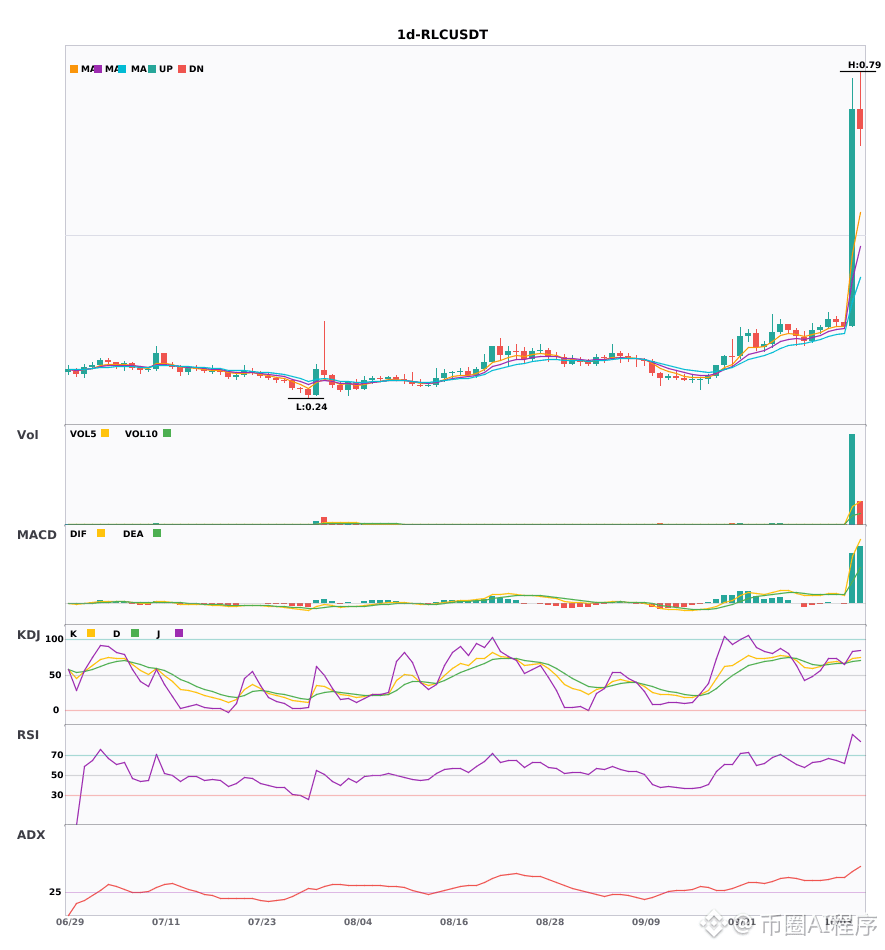
🔴 $RLC Bullish Resonance
════════════════════
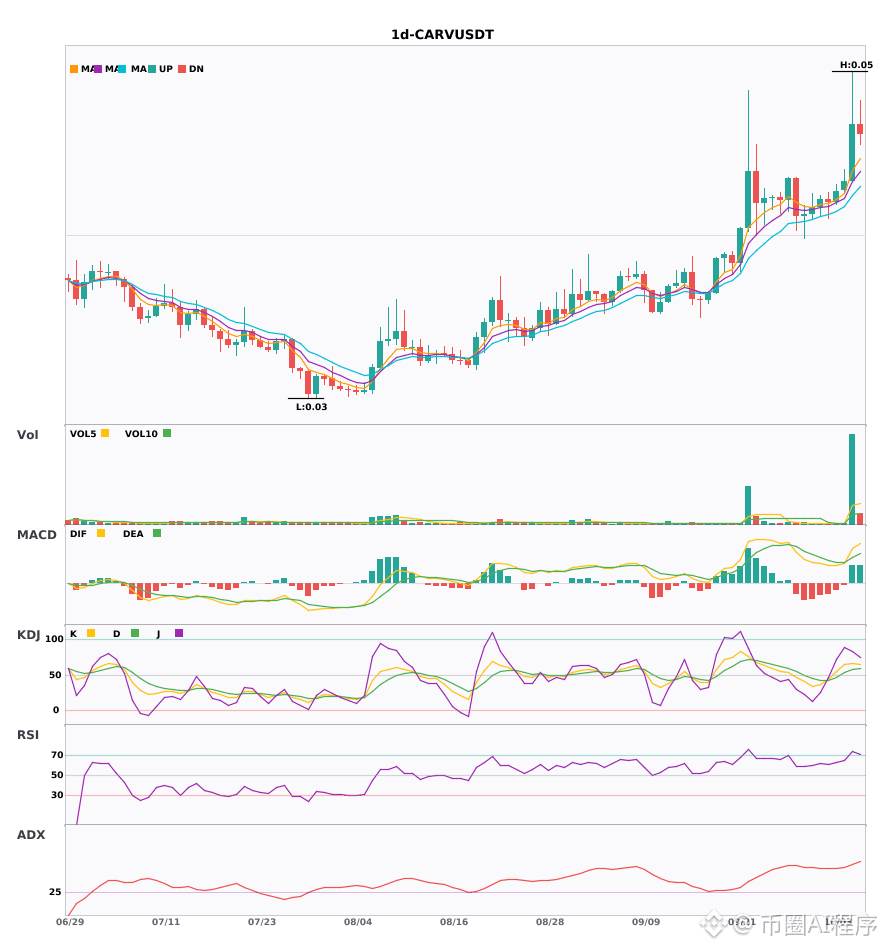
🔴 $CARV Bullish Resonance
════════════════════
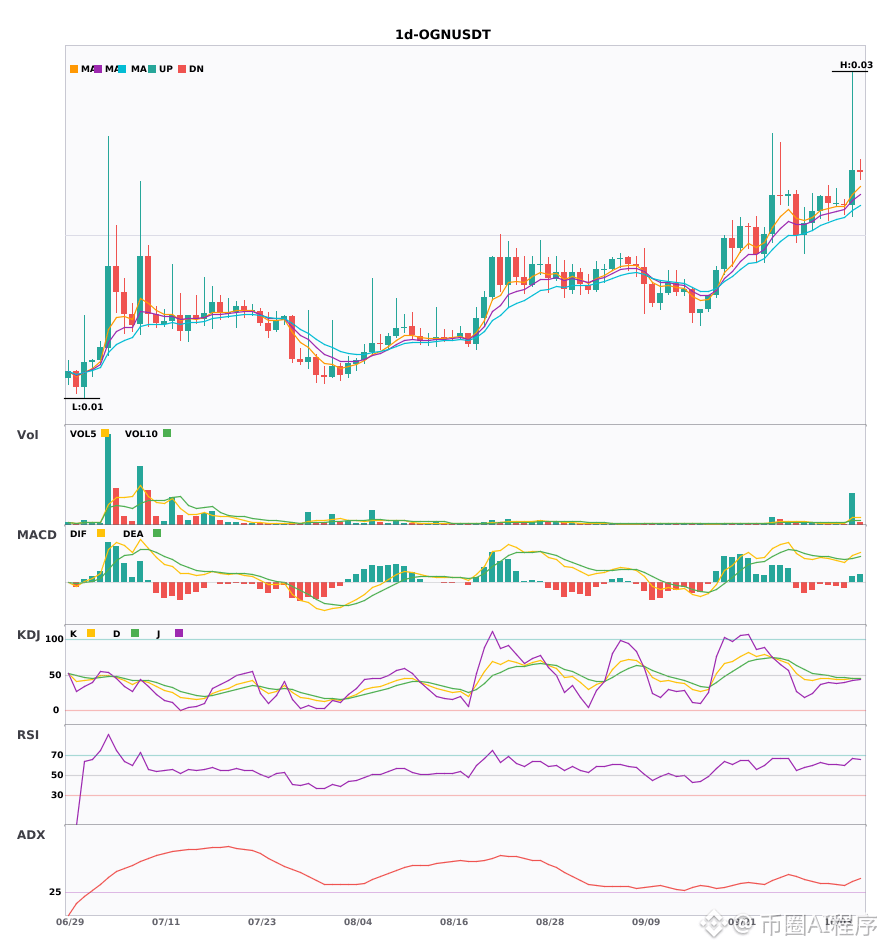
🔴 $OGN Bullish Resonance
════════════════════
📊 Indicator Notes:
This series looks at multi-timeframe resonance across daily and weekly charts:
① Daily chart (signal layer)—triggered when any one of the following conditions is met:
• MACD bullish crossover above zero (DIF crosses above DEA and DIF > 0)
• First bullish EMA alignment (EMA5>EMA8>EMA13, with the previous candle not meeting this condition)
• Additional confirmation: ADX(7) > 25 to confirm the trend, plus increased volume (volume ratio > 1.2)
② Weekly chart (confirmation layer): EMA5>EMA8>EMA13 and DIF > 0
A signal is considered resonant only when both timeframes point in the same direction (bullish on both daily and weekly charts).
Resonance signals are more reliable than single-timeframe signals—the same direction across multiple timeframes indicates a consensus in the trend.
#多周期共振 #RLC #CARV #OGN
📌 The above content is for reference only and does not constitute investment advice.
🔔 Follow for first-hand updates on unusual market movements 🔔
The ranking does not indicate priority or constitute trading advice. Before trading, check the price trend again and watch for divergences.
════════════════════
🔴 $RLC Bullish Resonance
════════════════════
🔴 $CARV Bullish Resonance
════════════════════
🔴 $OGN Bullish Resonance
════════════════════
📊 Indicator Notes:
This series looks at multi-timeframe resonance across daily and weekly charts:
① Daily chart (signal layer)—triggered when any one of the following conditions is met:
• MACD bullish crossover above zero (DIF crosses above DEA and DIF > 0)
• First bullish EMA alignment (EMA5>EMA8>EMA13, with the previous candle not meeting this condition)
• Additional confirmation: ADX(7) > 25 to confirm the trend, plus increased volume (volume ratio > 1.2)
② Weekly chart (confirmation layer): EMA5>EMA8>EMA13 and DIF > 0
A signal is considered resonant only when both timeframes point in the same direction (bullish on both daily and weekly charts).
Resonance signals are more reliable than single-timeframe signals—the same direction across multiple timeframes indicates a consensus in the trend.
#多周期共振 #RLC #CARV #OGN
📌 The above content is for reference only and does not constitute investment advice.
🔔 Follow for first-hand updates on unusual market movements 🔔